Software Engineers need to be expert in their tools. You can’t Google or AI everything and call yourself an expert. Your job interviews will not entail these resources anyway.
1.1 - Week 2
Refresher on important 131 concepts.
For all of the following, write both the function and some code that calls and tests the function.
Complete the following without using ANY outside aid. If necessary, refer only to the python help() command or the official documentation at https://python.org.
Use your preferred programming environment (IDLE, Pycharm, Visual Studio Code, etc.)
Write a function with two parameters: a string and an integer n. Using a for loop, print the string n times.
Write a function with one parameter: a list. Print each element of the list using a for loop.
Write a function with two parameters: a list and a target. Using a for loop, count the number of times target appears in the list and print the total.
Write a function with two parameters: a list and a target. Using a while or for loop, print the first index in the list where target appears. Print not present if it does not exist in the list.
Write a function with one parameter: a list of integers. Using a loop, count the number of even and odd integers in the list. Print the total count of evens and odds.
Solutions
There are a few ways to solve each problem. Here are a few: week2-soln.py
Submission
Submit your .py file to Canvas for a check. You are not graded on completeness or correctness – this is for learning and feedback.
Key Skills
Function definition with parameters.
Function calling.
Selection using if-else.
Iteration using a for loop and working with the list index.
Combining iteration and selection.
1.2 - Week 3
Reinforcing selection, iteration, and function calling.
Instructions
For all of the following, write both the function and some code that calls and tests the function.
Complete the following without using ANY outside aid. If necessary, refer only to the python help() command or the official documentation at https://python.org.
Use PyCharm to complete this task. I know that PyCharm has a built-in AI Assistant. I strongly recommend that you disable it. You are going to be quizzed on these skills in class, and you will not be allowed to use any outside assistance.
Write a function named multiply() with two parameters, a and b, that returns the result.
Verify that both a and b are integers.
Return nothing if either a or b is not an integer.
Write a function named divide() with two parameters, a and b, that returns the result of a / b.
Verify that both a and b are either integers.
Return nothing if either a or b is not a number.
Return nothing if b equals 0.
Write a calculator function
The function must contain an “infinite” while loop that does the following until the user chooses to ’exit'.
Prompt the user to make a choice of either multiply, divide, or exit.
Do not allow or handle an invalid choice.
If the user picks exit, the program must end.
Prompt the user to enter two values, a and b.
Based on their choice, call either your multiply() or divide() function.
If either multiply() or divide() returns nothing, print an error message.
Otherwise, print the result in the format, e.g, 4 * 5 = 20 or 2.4 / 1.2 = 2.0.
Round the divide result to the tenths place using the built-in round() function when printing.
Submission
Submit your .py file to Canvas for a check. You are not graded on completeness or correctness – this is for learning and feedback.
Key Skills
Function definition: parameters and returns.
Logical selection using if.
Type checking using isinstance().
Functions calling functions.
2 - 01. Intro to the CLI
This lab introduces essential Command Line Interface (CLI) commands for the OS.
You are responsible for knowing all the CLI commands in this lab.
By the end of the lab, you should be able to navigate your OS’s file system, manage files and directories, manipulate text files, and utilize process management commands.
Pro tips before you get started
Mega important:There is no notion of “undo”, a “trash can”, or a “recycle bin” in the CLI. You run a command, it’s done. So you have to be careful when you do things like delete or move files in the CLI.
Press the Tab key to autocomplete the command or filename you are typing. Big time saver.
Use the up arrow on your keyboard to cycle through the most-recently used commands you typed in. Good for re-running things.
Program going crazy and the CLI is not responding? Stuck typing and can’t get out? Press Control+C or Command+C. This sends a signal to the OS to kill the running process.
Class introduction
2.1 - Launching a Terminal
The terminal is the program that lets users access an OS’s Command Line Interface (CLI).
Launching a terminal on Mac
The terminal program on Macs is simply called “Terminal”. You can open it in two ways:
Finder → Applications → Utilities → Terminal
Press Command+Spacebar. Type “terminal” in the Spotlight Search popup and you will see an option to open the Terminal.
CMD+Spacebar is a great way to open apps quickly on Mac.
You may wish to drag the Terminal application to your Dock at the bottom.
The terminal on Mac will look something like this.
Windows
Windows has several terminal programs. Windows PowerShell and Command Prompt are for interacting with Windows CLI directly. We want to open an Ubuntu terminal for interacting with the Ubuntu OS you installed in the previous lab.
This is PowerShell. The rest of the CLI labs assume you are using PowerShell on Windows as it allows for more *nix style comamnds than the old-school Command Prompt.
Course Note: You need to know terms and concepts that look like this.
Directories hold files and other directories. When you use the term subdirectory, you are talking about the directories listed inside the current working directory.
Files represent programs, pictures, audio, video, word processing docs, etc. Files can be run by the operating system (in the case of programs) or opened by another piece of software, like Photoshop, Microsoft Word, or Python.
The file system has a root directory. On Mac (and Linux), this directory is named /. On Windows, it is typically C:\.
Mac & Linux uses forward slashes (/), whereas Windows uses backslashes (\). Use forward slashes (/) when in POwerShell and it will automatically transform them. Most software programs use /.
A user’s home directory is where their user-specific content lives, like documents and pictures that you save. On your personal computer, you probably only have one user. A lab machine will have many different users.
On Linux, the home directory for the user named ‘alice’ is /home/alice/
On Mac, it would be /Users/alice/
On Windows, it would be c:\Users\alice\
You can use the Terminal/CLI to navigate the file system, like you would graphically using the Windows Explorer or Mac Finder. As you navigate with the CLI, you are “in” one directory at a time. The directory that you are currently “in” is called the working directory. Commands run in the context of the working directory.
Explore the root directory using the ls and cd commands.
Open a Terminal for Mac or PowerShell for Windows.
Type in the following CLI commands one at a time and see what happens. The commands below have a # character, which indicated the beginning of a comment. # comments are there for clarification and you do not type them.
pwd# Print the path of the working directory.ls # List the files in the current directory.cd .. # Go "up" one level in the file tree.pwd# Print the path of the working directory.ls # This should now list different things.ls / # List the files in the root.cd / # Change working directory to root.ls # list files.cd .. # Go up... But it won't go anywhere because you can go higher!ls # You're still in the root. List root's files.
None of these commands change anything on your computer. They give you information and let you navigate between directories.
Mac users: If you encounter a Permission Denied error while running the ls / or cd / commands, try running sudo ls / or sudo cd /. It will prompt you to enter your password. The sudo command makes you an “administrator” in the eyes of the CLI. Mac is protecting the sensitive / directory, and wants to make sure you have permission to do what you’re trying to do.
Key Commands
pwd - Print Working Directory - what is the name of the directory you are currently “in”. Use then when you don’t know where you are.
ls - List contents. Will show both subdirectories and files in the working directory.
ls <target> - List the contents of target directory, e.g., ls /usr/
ls -l (Mac only) - Lists contents and gives you additional information, like the file type. May also do ls -l <target>
ll (Mac only) - Shorthand for ls -l. Can do ll <target>
cd - Change Directory. This is how you navigate.
cd / changes to the root directory
cd ~ or simply cd will navigate to the user’s home directory.
cd .. go “up” one level to the parent of the current directory
cd <target> changes to the <target> directory.
You can “jump” directories by putting the directories full name, like ls /usr/bin/. A directory’s full name is called its path.
You can also specify relative paths, which we will discuss more later.
The terminals are capable of autocompleting. Type cd to change to your home directory, then type cd D then hit the Tab key. What happens? The terminal will find all subdirectories (if any) of your working directory that start with capital D.
Extremely important point on Mac, Linux, and in most programs: file system names are case-sensitive. For example, you can have files named user.txt and User.txt and or a directory /usr/ and /Usr/ they are different. Capitalization matters in software development. Windows doesn’t care about capitalization (sometimes), but you should care.
Exercise:
(Mac) Navigate to the /usr/ directory.
(Windows) Navigate to the C:\Users directory.
Use the pwd command to display your current directory.
Type ls. What do you see?
(Mac only) Now type ls -l or ll. What do you see?
Use cd ~ to navigate to the home directory. Use ls to display the files and folders. What do you see?
Knowledge Check:
Question: What does the pwd command do?
Question: How do you navigate to the root directory?
Question: How do you navigate to your home directory?
By the end of the lab, you should be able to navigate the file system using the CLI, manage files and directories, manipulate text files, understand basic file permissions, and utilize process management commands.
Part 2: File and Directory Management
Reminder: All file system names a case-sensitive.
Now, let’s practice adding and removing files and directories using the CLI.
Creating and Removing Directories
mkdir - Make Directory
rmdir - Remove Directory
rm -r - Remove Directory and its contents recursively. WARNING: This is going to delete the directory and everything below it recursively. Linux does not have ‘undelete’, so be very careful with this command!
The commands below have a # character, which indicated the beginning of a comment. # comments are there for clarification and you do not type them.
cd# switch to your home directorymkdir MyLab
ls # You should see the new MyLab/ directory.cd MyLab
ls # You will not see anything. The directory is empty.cd ..
rm -r MyLab
ls # MyLab should now be gone
Creating, Copying, and Deleting Files
cp - Copy Files and Directories
rm - Remove Files
mv - Move or Rename Files
cd ~ # go to your home directoryls
touch sample.txt # Create blank filels
cp sample.txt sample_copy.txt
ls
mv sample.txt renamed_sample.txt
ls
rm sample_copy.txt
ls
cd ~# go to your home directoryls
echo "hello">sample.txt# create a text file containing the string "hello"ls
cp sample.txtsample_copy.txtls
mv sample.txtrenamed_sample.txtls
rm sample_copy.txtls
Exercise
Create a new directory named LabDirectory
Navigate into this directory using the cd command
Create a new file named LabFile.txt inside this directory. Use touch
Copy this file to a new file named LabFileCopy.txt. Use cp
Use the CLI to manipulate and print text files (like source code).
Part 3: Text File Manipulation
You can use the CLI to do simple or complex text manipulation. As developers, you will use an IDE like PyCharm or Visual Studio Code to do such tasks most of the time. However, it can be handy to do from the CLI sometimes. Many scripts used to compile and build software these CLI text-manipulation techniques.
Important concepts
Most CLI commands, including the ones you have already seen like ls and pwd have an output that is printed to the terminal. Some commands, like cp, do NOT have an output printed to the screen.
Below you will see the special > and >> operators.
> is the redirect operator. It takes the output from a command and writes it to a file you specify, e.g., echo "hello" > file.txt. It will create the file if it does not exist, and will overwrite the file if it does exist!
>> is the append operator. It will create the file if it does not exist, and will append to the end of the file if it does exist!
Viewing and Editing Text Files
echo - Display a line of text
cat - Concatenate and display file contents
more - View file contents one screen at a time
echo"Hello, CLI" > hello.txt
cat hello.txt
echo"Another line" >> hello.txt
cat hello.txt
seq 1110000 >> numbers.txt # making a big file - no need to learn. cat numbers.txt
more numbers.txt # Spacebar goes forward, b goes back, q to quit.
echo "Hello, CLI">hello.txtcat hello.txtecho "Another line">>hello.txtcat hello.txt1..10000|Out-Filenumbers.txt# making a big file. Don't worry about learning this command.cat numbers.txtmorenumbers.txt# Spacebar goes forward, b goes back, q to quit.
Exercise
Use echo to create a text file with some content. Try echo "this is my first file" > myfile.txt
Use cat will print all of the file’s contents to the screen all at once.
Use echo to append text to the file.
Use more to view the file content one screen at a time. Hit q to exit.
Knowledge check
Question: How can you append text to an existing file using echo?
Question: What command would you use to search for a specific word in a file?
We discussed what a process is when we introduced Operating Systems concepts. Below you will see a reference to PID - Process ID. This is an integer that uniquely identifies the process to the OS. As a user, you use the PID to specify which process you are talking about.
Run the following:
ps
top  # (Mac/Linux only) hit q or Control+C to quit the program.
Monitoring and Controlling Processes
ps - Report a snapshot of current processes
top - (Mac/Linux only) Display processes and how much memory or CPU they are using. Similar to the Activity Monitor on Mac and the Task Manager on Windows. Hit q to exit.
Use the keyboard combo Control+C to kill/quit the current process.
kill - Send a signal to a process
Exercise
We are going to install Python and create a wild task.
Open a second Termina by clicking the + button next to the tab in the menu of the current Terminal. You should see a second “fresh” terminal pane.
Now run python3 or python and create the following infinite loop. You can also do this in IDLE or other editor if having trouble running python from the command line.
python
whileTrue:print("hello there")
We should now have an out of control Python process gobbling up CPU cycles.
Switch back to the other Terminal tab and run the following commands.
ps
top # (Mac/Linux only) find the PID of the python process that is gobbling all the CPU# If using Windows, open the Task Manager programkill <PID> # Replace <PID> with the actual process ID
The terminal will not say anything, but run top again. The runaway Python process should be gone. Switch back to the Terminal tab where you had that Python process and it should say terminated or something similar.
Knowledge Check
Question: How can you view real-time process activity?
Conclusion
Anything you can do with your OS’s GUI, you can do on the command line. It just looks different. Become comfortable with the CLI – you will find that it can be MUCH faster for certain tasks, and will be indispensable to you as a software engineer.
Final Knowledge Check
Question: Summarize the steps to create a new directory, navigate into it, create a text file, and view it using less.
Question: From the CLI, how would you find the runaway process with a memory leak (probably using the most memory) and terminate it?
You will install a popular code editor, PyCharm, in your Linux-ish environment.
The most useful tool for a software developer, other than the brain, is an integrated development environment (IDE). You may have used IDEs in your classes, such as IDLE (which is bundled with Python), PyCharm, IntelliJ, Visual Studio, or XCode. IDEs usually have the following capabilities at a minimum:
Text editing for writing source code
Running the code
Debugging (more on this in the future)
Browsing files
Searching through files
Navigating through code structures easily
Most IDEs have many more capabilities. Software developers develop a preference for an IDE based on its capabilities, its ease-of-use, and the programming languages it supports.
In this class, we will use PyCharm, an IDE published by JetBrains. It has many handy features to support Python programming.
PyCharm works on Windows, Mac, and graphical Linux-based operating systems. If you are using Windows, we want to run it from our Linux environment
Choose the section corresponding to your Linux environment for instructions on installing PyCharm.
3.1 - for Mac
Instructions for installing PyCharm on Mac
This lab is for those who are installing PyCharm on Mac machines.
You will now see the Nano text editor in your terminal. Type or paste in the following:
#!/bin/shopen -na "PyCharm.app" --args "$@"
Hit Control+O to save, then Enter to accept the filename.
Hit Control+X to exit the text editor.
Run the following command in the Terminal:
sudo chmod +x /usr/local/bin/pycharm
You will now be able to type pycharm . in the Terminal to open PyCharm to edit the current directory’s contents.
Test drive
We are going to create a sample project directory using the Terminal, then open PyCharm and edit files in that directory. A video follows the steps.
Open the Terminal application.
Run the following in the Terminal:
cd ~ # make sure in your home directorymkdir seng-201 # This directory will hold all our code for the coursecd seng-201 # change to the new directorymkdir pycharm-test # Make a new subdirectory for a test project.cd pycharm-test # change into the subdirectorypycharm . # launch PyCharm in the current directory
The pycharm command launches the PyCharm program. The command pycharm . says launch Pycharm and have it open the current working directory. The symbol . always means the working directory. Sometimes it will be necessary to explicitly tell the CLI we are referring to the working directory; more on those situations as they arise.
A PyCharm window will open after a moment.
You may be asked if you “trust the authors of the files in this folder”. Click the checkbox and then pick “Yes, I trust the authors.”
Here is the process in a video:
Creating a new file
Let’s create a file in the Terminal in our project directory. We should see it immediately in PyCharm.
Go back to your Terminal and make sure you are in the pycharm-test directory.
Type the command touch hello.py to create an empty Python file.
Go back to PyCharm. You should see the file hello.py in the directory here. Click on it and it will open an empty editor pane.
In the code editor, type print("Hello World").
Go back to the Ubuntu Terminal and type cat hello.py. You should see the code.
Next
So you now have PyCharm successfully editing files and interacting with directories on Mac.
Locate the downloaded .exe file and double-click to run.
Choose the following options:
Finish the installation and run Pycharm.
Close any PowerShell or other terminal windows you have open.
Test drive
We are going to create a sample project directory using PowerShell, then open PyCharm and edit files in that directory. A video follows the steps.
Open the Terminal (PowerShell) application.
Run the following in PowerShell:
cd ~# make sure in your home directorymkdirseng-201# This directory will hold all our code for the coursecd seng-201# change to the new directorymkdirpycharm-test# Make a new subdirectory for a test project.cd pycharm-test# change into the subdirectorypycharm64.# launch PyCharm in the current directory
The pycharm64 command launches the PyCharm program. The command pycharm64 . says launch Pycharm and have it open the current working directory. The symbol . always means the working directory. Sometimes it will be necessary to explicitly tell the CLI we are referring to the working directory; more on those situations as they arise.
A PyCharm window will open after a moment, and you will be asked if you want to “trust” the directory. Select the top option and, if using your own computer, the bottom option:
PyCharm will finish opening, and you will see a code editor with a boilerplate main.py file.
Creating a new file
Let’s create a file in the PowerShell in our project directory. We should see it immediately in PyCharm.
Go back to PowerShell and make sure you are in the pycharm-test directory.
Type the command echo "print('Hello World')" > hello.py to create a Python file.
Go back to PyCharm. You should see the file hello.py in the directory here. Click on it and it will open an empty editor pane.
In the code editor, add the line print("How are you?").
Go back to the Powershell and type cat hello.py. You should see the code.
Next
So you now have PyCharm successfully editing files and interacting with directories on Mac.
This lab provides the minimum introduction to PyCharm needed to write programs. PyCharm has similar functionality to other professional IDEs, such as Visual Studio Code, IntelliJ, or XCode.
4.1 - Keyboard shortcuts
Accessing common commands quickly
Keyboard shortcuts
Everything you can do with a menu and a mouse has a keyboard shortcut. Menu+mouse is easier to learn, but keyboard shortcuts will make you about 30% more productive once you master them.
Rule of thumb: If you use the same mouse+menu commands over and over, learn the keyboard shortcut instead. Try to learn a shortcut or two each week.
I’ve highlighted my most-used keyboard shortcuts in the official cheatsheets from PyCharm:
I have created a seng-201/ subdirectory in my home directory symbolized by the ~. The tilde (~) is understood by your Terminal to mean “the current user’s home directory”.
Inside seng-201/, I have created subdirectories for each project.
Rule #2: Open the specific project directory in PyCharm, not the parent directory. Suppose you want to work on assignment1, then you need to open the assignment1/ directory. You open a folder in PyCharm in two ways:
Use your Terminal/CLI to cd into the project folder, then type (Windows) pycharm64 . or (Mac) pycharm .. Note that the . is important.
Open PyCharm first, then do File → Open. Select the project directory, then click OK.
The folder you open serves as the working directory for PyCharm. Do not open the parent directory, seng-201/, as it may create challenges running the Python code in the various subdirectories.
Project pane
The Project pane is where you browse and manage files. Open it by clicking on the foldier icon in the left sidebar:
Things you can do here include:
Create new files and subdirectories.
Double-click files to open.
Right click files and directories for a variety of tools, like renaming and deleting.
Exercise
Click on the pycharm-test name. You created this folder when following the labs to install PyCharm.
Now right-click the directory name, then New → Python File. Give it a name like foo.py.
You will see an editor tab pop open on the right with the name foo.py at the top.
Knowledge check:
Question: (True/False) Each coding project should have its own directory on the filesystem?
Question: (True/False) It’s okay to open the parent directory holding multiple projects in PyCharm?
Question: What CLI command do you run to open PyCharm from the current directory?
4.3 - Editing code
Tips and tricks for editing code with PyCharm
Editing
An Editor pane will automatically open every time you open a file. Things to know about the Editor windows:
PyCharm automatically saves your files. No need to explicitly save.
The line numbers on the left side are used to identify individual lines of code in error messages and elsewhere.
Familiar text editing features like Cut and Paste are available in the Edit menu at the top or Right-Clicking in an editor window. Learn those keyboard shortcuts!
CMD+/ (Mac) or Ctrl+/ (Windows, Linux) toggles comments on the current line or selected lines. This is one of my favorite keyboard shortcuts!
Suppose your code calls a function defined elsewhere. Hold down Cmd (Mac) or Ctrl(Windows, Linux) and hover over the function call. It will turn blue like a link. Left click the link and the function definition in the editor. Very handy! Look up the Go back keyboard shortcut to return your cursor to where you were.
Not happy with a variable or function name? Right-click it > Rename... It will be renamed everywhere in scope!
Use the arrow keys to move the cursor one character at a time. Hold down Ctrl (Windows, Linux) or Option (Mac) while tapping the left- or right-arrows. You will skip entire “words”. Again, very handy. Hold down Shift as well to select those words!
Exercise
Create a new file called fib.py in your pycharm-test folder and paste in the following code:
deffibonacci(n):"""
Computes and returns the Fibonacci sequence of length n.
Assumes n >= 1
"""ifn==1:return[1]ifn==2:return[1,1]result=[1,1]foriinrange(2,n):result.append(result[i-1]+result[i-2])returnresultprint(fibonacci(1))print(fibonacci(2))print(fibonacci(6))print(fibonacci(10))
Hold down Cmd (Mac) or Ctrl (Windows, Linux) and mouse over one of the fibonacci() calls at the bottom. Click the link and watch the cursor jump.
Using the keyboard shortcut, comment out the first three print(...) calls at the bottom all at once.
Now uncomment them all at once.
Right-click a fibonnaci() call and rename the symbol. Where does it change in the code?
Hit Ctrl+Z or Cmd+Z to undo the rename.
Knowledge check:
Question: How do you comment/uncomment a block of code with your keyboard?
Question: What does holding down Cmd or Ctrl + left-clicking on a name in the editor window do?
Exercise: Add a second function to your fib.py file named hello() that simply prints Hello World when called. Now, try to rename (as described above) the hello function to fibonacci, which already exists. Describe what happens.
4.4 - Running code and the integrated terminal
How to run Python code and leverage PyCharm’s terminal.
PyCharm uses tools installed on your computer to run programs. PyCharm should automatically find the Python you have installed on your computer if installed in a “standard” location.
Running code
There are multiple ways to run a program file:
In the editor window, Right-click anywhere in the code to open the context menu, then select Run [filename] or Debug [filename].
If necessary, select the Python Debugger popup, and select default options of subsequent pop-ups until you see the program run in the interactive Terminal at the bottom.
We will discuss the difference between Debug and plain Run in the future.
Use the run shortcuts at the top of the PyCharm window. You select the file you want to run from the dropdown, and then either the Run or Debug button. By default, PyCharm will run the most recent program run.
Use keyboard shortcuts to re-run the most recent program:
Shift+F9 (Windows, Linux) or ^D (Mac) to Debug
Shift+F10 (Windows, Linux) or ^R (Mac) to Run without debugging.
Exercise
Create hello.py in the pycharm-test directory if needed and add print("Hello World")
Run hello.py using the the context window.
Run it using the PyCharm toolbar.
Run it using keyboard shortcuts.
When you run your hello.py program, you should see output in the Debug or Run pane at the bottom. The exact output differ from mine, but you should see Hello World in there.
The Integrated Terminal
PyCharm also has an Integrated Terminal, which is an embedded version of the Command Prompt (Windows) or Terminal (Mac). You can use CLI commands like cd, ls, mkdir, etc.
Open the Integrated Terminal by either:
Clicking the Terminal icon in the bottom left
Using the PyCharm menu, View → Tool Windows → Terminal
Using the keyboard shortcut Alt+F12 (Windows, Linux) or Option+F12 (Mac)
When you ran your hello.py program, you should have seen a flurry of output in the Integrated Terminal window at the bottom. What just happened?
PyCharm opened a Terminal CLI, like you did in the Launching a Terminal lab, except this one is embedded in PyCharm.
PyCharm issued the CLI command python with your file as an argument.
python runs in the Terminal and prints output.
I find it convenient to use this integrated Terminal rather than switching to a another window. Or you may prefer to keep them separate. Do what works for you.
Exercise
List directory contents in the integrated Terminal using the ls command.
Type cd ~ in the integrated Terminal to switch to your home directory. Notice how the contents of the Project pane do not change. You are only changing the working directory in the Terminal.
Use the Terminal to navigate to your pycharm-test directory using cd commands.
Run the command touch hello2.py. Does it appear in the Explorer pane?
Run the command rm hello2.py. What happened? What happened in the Project pane?
Knowledge check:
Question: What is the keyboard shortcut for debugging/running your program?
Question: How do you open the integrated Terminal in PyCharm?
Question: How can you print the name of the current working directory in the integrated Terminal?
Question: If you have a runaway process in the integrated Terminal, how do you cancel/kill it so that you regain control of the Terminal? (The answer is the same as for the regular Terminal.)
5 - 05. Debugging
Debugging strategy and the basic features of the PyCharm debugger.
This class recording here is the companion to the Terms and Concepts and PyCharm Debugger labs below.
5.1 - Terms and concepts
Vocabulary you need to know plus what debugging really is.
Setup
Open your Terminal:
Terminal app on Mac
PowerShell on Windows
Use the Terminal to create a directory called debugging-lab/ in the same place you are gathering all your code for this class.
Download bad_math.py and save it to the debugging-lab/ directory.
Open the debugging-lab/ directory with PyCharm.
Select the bad_math.py file, then Run it WITHOUT DEBUGGING, either:
Right click in the editor and select Run 'bad_math'
Click the Play button next to bad_math in the toolbar
The program should crash with an error.
What is debugging?
Debugging is the process of understanding how a program arrived at a particular state.
Errors are incorrect calculations or bad states of a program. An error occurs while the program is running. Errors show as bad output, crashes, and the like. Debugging is often about comprehending how you arrived at an error.
Defects are programming mistakes, logic flaws, or problems with design that could lead to errors. What did you do wrong?
Defects are problems or mistakes, errors are the tangible result of running a program with a defect.
Colloquially, we conflate these two terms into the concept of a “bugs”, and hence the term “debugging”.“Bug” is an old term pre-dating computers, but Admiral Grace Hopper, who is the main reason we no longer program in Assembly Language, popularized the term “bug” in computing after she found one in the Harvard Mark II computer:
What is program state?
You have no doubt used print() statements to understand your program by printing variables, or printing here to see if a line executes is common. You are debugging using print statements.
Think about what these print statements tell you. They tell you:
What are the variable values at a point in time?
Which lines of code are getting executed when?
These two pieces of information are the essence of debugging. Let’s formalize them:
step: the program statement (often a single line of code) that was just executed.
state of a program is comprised of:
the variable values at the step.
the call stack at the step. We will explain this in a moment.
Debugging is trying to understand how you arrived at a state. Sometimes that state is an error, sometimes you want to figure out how you get to a certain point.
Debugging from an exception
Let’s examine some debugging info assuming you follow the Setup at the top of the lab.
If the program crashes due to an exception, the stack trace will usually point you to the line of code that exploded:
There is a lot of useful information in this stack trace to start the debugging process.
It tells you that the error is in bad_math.py, line 4 and even shows you the offending line of code.
Don’t fix any bugs yet. We want them for the next lab.
The error is an IndexError: list index out of range. So the program tried to execute numbers[i] but likely i was too big.
The other lines show the call stack, or the chain of function calls that are active in memory. In Python, the top-most function was called first, and the bottom-most function was called last (it is the reverse in Java):
Line 30 of <module> called the main() function.
- <module> represents the file bad_math.py itself and any code in the file that is not in a function or class.
Inside main() on line 18, largest_number = find_largest(numbers) was called.
Finally, inside find_largest(), the buggy line was called that generated the exception and crashed the program.
So the call stack is the chain of active functions that are waiting for something to be computed and returned. <module> -> main() -> find_largest(), which errored out. Look at the code itself to confirm the chain of function calls.
Congratulations! You have found some essential debugging information: the step at which the error occurred and the call stack portion of the state. What key debugging information are you missing?
The variable values! Now go to line 4. Add print(i) and print(numbers) right before that line to see what values i and numbers when the crash happens. That should give you a strong hint on what happened and how to fix it.
Don’t fix any bugs yet. We want them for the next lab.
Debugging is a process
A good software engineer follows a structured process. Use the exception message or your knowledge of the program to say, “Well, the problem could be this.” Form a hypothesis. Then add print statements to help determine state around the problematic step. Try different input values to confirm your hypothesis.
Maybe you will discover your hypothesis is incorrect. No problem! Maybe the error is actually due to something earlier in the call stack. Move your print statements up the stack and try again.
Whatever you do, build and refine your hypotheses. Do not just try something to see if it works. You may get lucky and fix the problem, but if you don’t understand the fix, how do you really know? You will also be doomed to make the same mistake again if you don’t understand what happened.
A better way?
You can debug just fine with print statements, but managing them is tedious. You will also have times where it would be useful to pause execution of the program at a certain point say, on the first iteration of a loop.
You can get state with print and control steps with code, but modern debugging tools will simplify this process while keeping your code clean.
We illustrate how to use PyCharm’s debugger in the next lab.
Knowledge check
Question: What two elements comprise the state of a program at a particular step?
Question: Suppose you use a constant value that never changes in your program, like pi = 3.14159. Do you think the variable pi is part of the program state? Why or why not?
Question: When do you see a stack trace? What information does it contain?
Question: Explain the difference between an error and a defect. Give an example of a defect and its resulting error.
Question: What information about the running program is contained in the call stack?
5.2 - The PyCharm debugger
Use the power of the IDE to understand your code.
Debugging support tools have been around since the 70s. All modern IDEs let you control the steps of program execution while showing the program state. Debugging tools, properly used, are much more efficient than print statements.
Open the debugging-lab/ directory and open bad_math.py in an editor.
Run the program in debug mode by doing one of:
Hit your F5 key.
Right click in the code editor and select Debug 'bad_math'.
Click the Bug button at the top of PyCharm.
The PyCharm debugger should now launch. Notice that you are now in the Debugging pane of PyCharm, which is accessible anytime from the left sidebar. This pane will open any time you Run a program with debugging.
You should see something similar to the following:
The bad_math.py program should crash with an exception. Here are the essential elements you see:
The editor highlights the line where the program crashed. The red lightning bolt in the left indicates an exception was thrown. You can see the full exception text by clicking the “Console” tab.
These are the step controls. PyCharm automatically paused on the step that caused the crash. More on the controls below.
The variable pane shows the values of all variables in scope at the current step. Variable values are one part of the program state.
The call stack is the other part of the program state. It shows the stack of function calls that arrived at the current step.
Using the step controls, hit either the green “play” icon or the red “stop” icon. Stop will cancel execution and produce nothing, play will continue execution of the program, resulting in the exception printing in the Terminal (where the program is running) and the program will crash.
Breakpoints and stepping
The PyCharm debugger will automatically break (pause) execution on steps that throw an exception. You can look at the variable pane and call stack to understand the state of the program and hopefully gain insight into what happened.
However, you will often want to break execution at step of your choosing, not just when an exception happens. Maybe want to see how a value was computed and what the variables were well before the crash happened. Or maybe your program doesn’t crash at all, but simply produces the wrong output.
You add breakpoints in the IDE to tell the debugger on which step(s) to pause execution. To set a breakpoint:
Set a breakpoint by left-clicking on the line number in the code editor. A red dot will appear to indicate the breakpoint. Set a breakpoint on line 3.
Click the breakpoint again to remove it.
You can set multiple break points.
You cannot set a breakpoint on a blank line of code.
Launch the debugger by pressing F5 or right-clicking and Debug 'bad_math'.
The debugger will break (pause execution) on line 3 or on whichever line you placed the breakpoint.Notice how PyCharm puts the current values of the variables largest and numbers in both the editor and the variable pane.
Use the step controls to control the execution of the program. All of these controls have a keyboard shortcut as well.
- Resume execution until the next breakpoint or the program ends.
- Step Over the current line, which means evaluate the line and go to the next one.
- Step Into the current line. If the current line calls a function like if my_fun(x) == True, the debugger will step into the my_fun() function and step through it. If you did step over, the debugger would evaluate the entire line including the my_fun() call without pausing.
- Step Into My Code. The same as the previous Step Into, but only step into source code files in your project. Suppose you call random.randint(0,10) which is a function imported from a Python library. Step Into will take you to the implementation of randint(). Step Into My Code will skip it because you did not write that code.
- Step Out of the current function. This will immediately complete all lines of the current function and pause at the line that called the current function in the call stack.
- Restart the debugging on the program. Just like re-running it. All your breakpoints will be retained.
- Stop the debugger without further execution of the code.
Use the controls to Step Over a few lines. Notice that the variable pane, watch pane, and call stack update with each step.
Using breakpoints and the step controls, you can precisely control the execution of the program to more methodically track down what is going on.
Adding a watch variable
The Threads & Variables pane shows all variables in scope at each step. In bigger programs, the variable list can be huge and you won’t care about most of them. To help, you can specify watch variables and watch expressions that always display at the top of the Threads & Variables pane.
To set a watch variable:
Set a breakpoint and start debugging the program
Select the variable in the editor or in the threads & variables
Right Click and Add to Watches
Now you will see your watched variables update as you step through the program. You can add as many watch variables as you like.
Adding a watch expression
You can also watch a complete expression, such as a boolean comparison. This can be particularly useful for debugging if-else statements and loops.
To set a watch expression:
Select the expression you want to evaluate in the editor.
The expression must be valid. So if you have the line if numbers[i] > largest:, select only the numbers[i] > largest portion of the statement.
Right click and Add to Watches.
Conditional breakpoints
You will also find it useful to only have a breakpoint trigger under certain conditions.
For example, you are reading file of 10,000 hospital patient records and you figure out that the program crashes when it gets to the record belonging to “Alice St. John”. Unfortunately, Alice is record 342. You don’t want to set a breakpoint on the offending line and have to hit the Continue control 341 times to figure out what’s going on with Alice’s data.
Enter the conditional breakpoint, which is a breakpoint that only pauses execution when an expression you specify evaluates to True. Try it with our bad_math.py sample:
Set a regular breakpoint on line 3 and Debug the program. It stops on the first iteration.
Right click on the breakpoint on line3. A textbox will appear. Type largest == 12 in the textbox.
Note: You can also add conditional breakpoints without creating a plain breakpoint first by right-clicking in the gutter.
Now hit the Continue control or restart the program in Debug mode. The conditional breakpoint will only pause when largest == 12.
Conditional breakpoints are extremely useful for refining your hypothesis as to what’s going on. Note you can enter any Python expression that evaluates to True or False, for example:
largest == 12 and i < 8
largest >= 5
Starting with vs. without debugging
When running your program, you have the option to Debug or Run. What’s the difference?
Run will not pause on breakpoints or exception, nor will variable values be tracked. Your breakpoints and watch variables will remain in PyCharm, but they are not updated.
Debug will do everything we showed, but significantly slows down the execution time of your program. This is because to enable debugging your code must be instrumented to enable the debugger to control execution and evalute variable or expression values. Think of instrumentation as adding an if breakpoint is True before every line of code as well as a print statement. Running debug mode for a large, complex system, can be costly.
Exercise
There are 4 bugs present in the initial bad_math.py that can be triggered based on which value the numbers variable has. The various calls to main() at the bottom of the file are sufficient to reveal all the bugs.
Find and remove them. There are multiple ways to squash the bugs. You may squash two bugs at once depending on how you fix the first bug that causes the exception we have seen in our examples.
Your output should look like the following if you gracefully fix the bugs:
Numbers: [2, 8, 1, 6, 3, 12, 5, 9]The largest number is: 12The average is: 5.75
✅ All calculations are correct.
--------
Numbers: [32, 16, 8, 4, 2, 1, 0]The largest number is: 32The average is: 9.0
✅ All calculations are correct.
--------
Numbers: []The list of numbers cannot be empty.
--------
Numbers: [2]The largest number is: 2The average is: 2.0
✅ All calculations are correct.
--------
Numbers: [12, 12]The largest number is: 12The average is: 12.0
✅ All calculations are correct.
--------
Knowledge check
Question: How do you run a program in debug mode in Pycharm?
Question: How do you add a variable to the watch list from the editor view?
Question: How do you set a conditional breakpoint that pauses when x evaluates to False?
Question: What is the difference between Step Over and Step Into in terms of the next step of execution?
This program tells you what the nth Fibonacci number is.
Enter a number for n: 4Fibonacci number 4 is: 3This program tells you what the nth Fibonacci number is.
Enter a number for n: 7Fibonacci number 7 is: 13
Inventory Management System
1. Add item
2. Remove item
3. Check stock
4. Exit
Choose an option: 1Enter item name: apple
Enter quantity: 10Added 10 of apple. Total: 10Inventory Management System
1. Add item
2. Remove item
3. Check stock
4. Exit
Choose an option: 2Enter item name: apple
Enter quantity to remove: 15Error: Not enough stock of apple to remove. <--- note change!
Inventory Management System
1. Add item
2. Remove item
3. Check stock
4. Exit
Choose an option: 1Enter item name: orange
Enter quantity: 10Added 10 of orange. Total: 10Inventory Management System
1. Add item
2. Remove item
3. Check stock
4. Exit
Choose an option: 2Enter item name: orange
Enter quantity to remove: 10Removed 10 of orange. Remaining: 0orange is out of stock. <--- note change!
6 - 06. Testing
Introduction to testing concepts and automated unit testing.
Testing is integral to all forms of engineering. Software developers often write as much test code as they do product code! This set of labs introduces testing concepts and automated testing.
6.1 - Assertions
The building block of testing.
Class video from Spring 25
Ignore the slide about exams.
Software testing
Software testing is both a manual and an automated effort.
Manual testing is when a tester (or user) enters values into the user interface and checks the behavior of the system.
Automated testing is where test code is used to check the results of the main product code. Automated testing is an essential part of program verification, which is an evaluation that software is behaving as specified and is free from errors.
Automated testing is a necessity in real systems with thousands of lines of code and many complex features. Manual testing is simply infeasible to do thoroughly.
Code that verifies code?
Automated testing in this case means writing code. Developers and testers write code and scripts that executes and tests some other code.
Exercise
Create a directory named testing-lab in your seng-201/ directory.
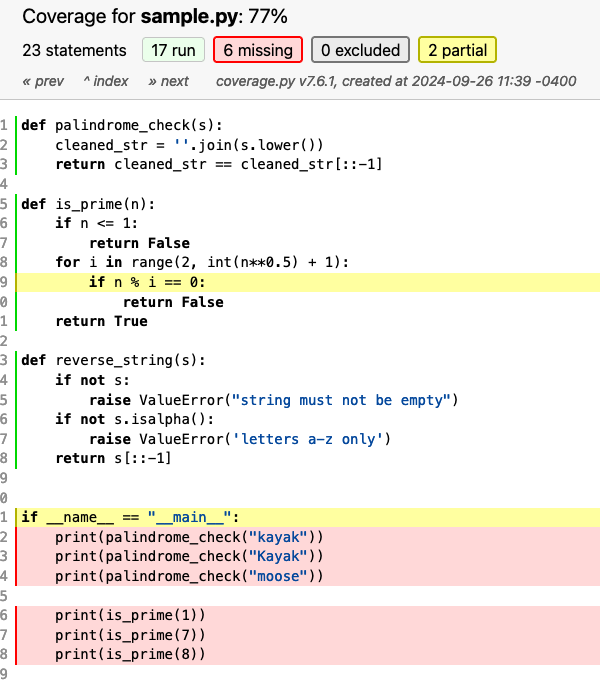
Download sample.py and put it in the testing-lab/ directory.
Open the folder in PyCharm and run sample.py.
The function calls in the __main__ section of code are a semi-automated test. The calls are automated, but the verification is still manual – you, the developer, have to verify that the output is indeed correct.
To have automated testing, we need a programmatic indicator of correctness. Enter the assert statement.
The assert statement
Nearly all programming languages have an assert keyword. An assertion checks if a value is True or False. If True, it does nothing. If False, the assert throws a special type of exception. Assertions are commonly used in languages like C and Ada to verify that something is True before continuing execution.
In most modern languages, including Python, the assert is the basis of automated testing.
Exercise
Let’s explore the assert in Python.
Create a new file named test_sample.py in the testing-lab/ directory. Edit the file in PyCharm.
Add the following code:
test_sample.py
assertTrueassertFalseprint("Made it to the bottom.")
Run test_sample.py. Notice the following.
assert True does not produce any output. The program simply continues.
assert Falsegenerates an exception. This is expected.
The print(...) statement did not execute because the exception generated by assert False crashed the program.
Comment out the assert False line and run it again. The print(...) statement will execute.
This demonstrates the behavior of assert. Let’s add some more interesting assertions. Add the following lines to the bottom of test_sample.py:
test_sample.py
x=2**5assertx==32asserttype("Bob")==stry=16assertx-y==16andtype("Bob")==strandint("25")==25print("Made it to the bottom.")
The right-hand side of the assert statements now use comparisons and boolean operators. This looks a bit more realistic. The assert can have any simple or complex Boolean expression so long as it evaluates to True or False.
Quick Exercise: Change the operators or values in the expressions so they evaluate to False. Notice how the last assert can fail if any of the comparisons are false.
We’ll put our assertions to work testing program code in the next lab.
Knowledge check
Question: What two things are you trying to verify with program verification?
Question: Why do we need automated testing?
Question: What happens next if a Python program encounters the statement assert True?
Question: What happens next if a Python program encounters the statement assert False?
Question: What happens when the following executes: assert 16 == 2**4?
Question: What happens when the following executes? assert len('Bob') > 0 and 'Bob' == 'Alice'
6.2 - Unit testing
Using assertions to test a file.
Class video
Testing sample.py
Assertions are the basis of modern automated testing. Developers write test code in source files that are separate from the main program code. We have our program code in sample.py and the test code will be in test_sample.py. This is a common naming convention.
Now, let’s use our assert to test the correctness of the functions in sample.py.
Comment out all the code in test_sample.py
Add the line import sample. In Python, this makes the content of sample.py accessible to code in test_sample.py.1
Now let’s convert those print(...) statements from sample.py into assert statements in test_sample.py. test_sample.py should now have the following:
test_sample.py
importsample# We import the filename without the .pyassertsample.palindrome_check("kayak")# the function should return True, giving "assert True"assertsample.palindrome_check("Kayak")assertsample.palindrome_check("moose")isFalse# the function should return False, giving "assert False is False", which is Trueassertsample.is_prime(1)isFalseassertsample.is_prime(2)assertsample.is_prime(8)isFalseassertsample.reverse_string("press")=="sserp"# checking result for equality with expectedassertsample.reverse_string("alice")=="ecila"assertsample.reverse_string("")==""print("All assertions passed!")
Point 1: We access the functions in sample.py by calling, e.g., sample.palindrome_check(...). The prefix sample.X tells Python “go into the sample module and call the function named X.” We would get an error if we called only sample.palindrome(...) because Python would be looking in the current running file, which has no such function defined in it.
Point 2: In Python, you should check if a value is True or False using is. The is operator returns a boolean. You could also type x == True or x == False. Either form will work, but is is preferred2.
Point 3: Remember that palindrome_check() and is_prime() return True/False themselves. We are simply verifying that they are returning the correct value. reserve_string() returns a string value, so we need to compare using == to an expected value.
Point 4: The program will crash with an AssertionError if any of the assert statements are False. Mess up one of the assertions to verify this.
Exercise
Go to sample.py and define a function named power() that takes two parameters, x and y, and returns the computed result of xʸ.
Add assert statements to test_sample.py to verify your function behaves correctly.
Unit tests
The file test_sample.py is what software engineers call an automated unit test. A unit test is a group of test code (usually one file) that verifies a single class or source file3. Unit tests are usually written by the same developer who wrote the program code.
Our automated unit test now calls functions and use assert statements to verify that they are returning the expected results. If an assertion fails, the test fails.
What does it mean if a test fails? One of two things:
Either there is something wrong in the program code. Maybe there is a logic error.
The test code itself has a mistake in its logic.
Regardless, if a test fails, you need to figure out why. A good unit test will systematically exercise all the logic of the function or module under test. This can help uncover flaws in the program code. We will discuss strategies to do this in subsequent lessons.
We also need a way to run the test code and accumulate the results in a useful way. We will do this in the next lab.
Knowledge check
Question: Suppose you wanted to test a function named get_patient_priority(str) in hospital.py. What would you have to do to call the function from your test code?
Question: The right hand side of an assert statement can be any expression (simple or complex) as long as it evaluates to _____ or _____.
Question: Who writes unit tests?
Question: The name for a test that tests an individual module is a ______ test.
Question: Why do you think we write separate assert statements for each function input, rather than one assert statement that calls the function multiple times with different inputs? That is, why not do assert sample.reverse_string("alice") == "ecila" and sample.reverse_string("") == ""?
In Python parlance, a single file is called a module. You can create complicated modules that are collections of multiple source files. This is how many popular Python libraries like random work, as do third party libraries like pytorch and keras used for machine learning. It is a way to bundle functions and classes for convenient use in source code. ↩︎
If you are dying to know the difference between x is False and x == False, it’s because many other values are equivalent to True and False when using ==. Empty values, such as 0 or [] are == False (try it). But only False is False. Similarly, only True is True, but 1 == True. ↩︎
The unit is usually a single class. However, in our case, there is no class, but a collection of functions in a file. Some people treat a file as a unit. But a file can have multiple classes in it. The definition of a unit is a bit fuzzy, but usually refers to either a class or a single file. ↩︎
6.3 - Structuring test code
Organizing the test code has benefits, just like organizing program code.
Class video
Limitations to the current approach
In the previous lab, we gathered our assert statements into a test file that can be run. If the test file runs to completion, our tests have passed. If it fails with an AssertionError, we know that a test has failed and something is wrong (either with the program code or the test code itself). We have the beginnings of automated unit testing.
Our current goal
What we have so far is a good start, but we have two things to improve upon:
Currently, we can only fail one assert the test file at a time because a failed assertion throws an exception and halts the program. Ideally, we would like to run all tests and identify which individual ones are failing.
We would like to collect our test results in a human-friendly format. I run the test, I get a summary of passes and fails.
We can accomplish these both these things. First, we need to organize our test cases in our test file. Second, we will need help from developer tools.
importsample# We import the filename without the .pyassertsample.palindrome_check("kayak")# the function should return True, giving "assert True"assertsample.palindrome_check("Kayak")assertsample.palindrome_check("moose")isFalse# the function should return False, giving "assert False is False", which is Trueassertsample.is_prime(1)isFalseassertsample.is_prime(2)assertsample.is_prime(8)isFalseassertsample.reverse_string("press")=="sserp"# checking result for equality with expectedassertsample.reverse_string("alice")=="ecila"assertsample.reverse_string("")==""print("All assertions passed!")
Remember, we use the naming conventiontest_<file>.py to identify the unit test for <file>.py.
Organizing test code into test cases
To meet our goal, we will first organize our assert statements into test cases, which has a conceptual and a literal definition:
test case (concept): inputs and expected results developed for a particular objective, such as to exercise a particular program path or verify that a particular requirement is met. [Adapted from ISO/IEC/IEEE 24765].
test case (literal): a test function within a test file.
Let’s start simple. Let’s move the assert statements that test each function into their own functions in the test file like so:
test_sample.py
importsample# We import the filename without the .pydeftest_palindrome():assertsample.palindrome_check("kayak")# the function should return True, giving "assert True"assertsample.palindrome_check("Kayak")assertsample.palindrome_check("moose")isFalse# the function should return False, giving "assert False is False", which is Truedeftest_is_prime():assertsample.is_prime(1)isFalseassertsample.is_prime(2)assertsample.is_prime(8)isFalsedeftest_reverse():assertsample.reverse_string("press")=="sserp"# checking result for equality with expectedassertsample.reverse_string("alice")=="ecila"assertsample.reverse_string("")==""# run the test cases when executing the fileif__name__=="__main__":test_palindrome()test_is_prime()test_reverse()
We say now that each of test_palindrome(), test_is_prime(), and test_reverse() is a test case. We have three (3) test cases in one (1) unit test file.
Note the naming convention: all the test case functions begin with the string test_. This is a requirement of the developer tool in the next lab that will help us run multiple test cases even if one of them fails.
The block beginning with if __name__ == "__main__": allows us to run the tests by running the file. You should not see any output when you run the unit test because all of these assert statements should evaluate to True.
Diversifying our test cases
One test case for each function in your program code is where you should start. However, we often want more than one test case per program code function. Why?
Consider why we have multiple simple assert statements. Suppose we have the following valid assertion: assert sample.is_prime(1) is False and sample.is_prime(2). Now, suppose this assertion failed due to a bug in our program code. The bug could either be with the logic of dealing with the input 1 or 2. We put our checks in separate assert statements so we know precisely which input caused an error in the program code.
The same strategy applies when unit testing program code.
Program paths
A program path is a sequence of instructions (lines of code) that may be performed in the execution of a computer program. [ISO/IEC/IEEE 24765] Take a look at is_prime() in sample.py:
Giving the input 1 executes lines 5, 6 and 7. This path (5,6,7) deals with special cases where our input is ≤ 1. One (1) itself is not prime, and neither are 0 or negative numbers by definition.
Giving the input 4 executes lines 5, 6, 8, 9, and 10. This path (5,6,8,9,10) accounts for numbers > 1 that are not prime.
Giving the input 5 will execute lines 5, 6, 8, 9 and 11. This path (5,6,8,9,11) accounts for numbers > 1 that are prime. The input 3 is a special case of this that does not include line 8.
Path testing
Let’s group assert statements that test “a particular program path” or “a particular requirement” (see the test case definition) into separate test cases. Change test_is_prime() to the following:
These test cases both verify is_prime() but examine different program paths.
test_is_prime_special_cases() tests path #1 (previous subsection). We know something is wrong with the part of our algorithm that handles the special case of integers ≤ 1.
test_is_prime() tests paths #2 and #3. WE know something is with the part of the algorithm that checks if the input is divisible by a potential factor if that test case fails.
The ability to pinpoint where the algorithm is failing is very useful to the developer when they go to debug. Especially when you have many test cases and hundreds of lines of program code.
Some functions only have one program path, and so one test case may be sufficient.
Your testing strategy
Writing separate test cases for each program path or requirement is a testing strategy. But, it can be hard to know how much to identify the program paths or to know how many tests are “enough”.
For now, start with one test case per program function.
Then ask yourself, “are there sets of input where the program behaves differently than for other inputs?” If so, divide your test case to separate those input sets. In is_prime(), the program behaves differently if you give it inputs ≤ 1 vs. inputs > 1 that are prime vs. inputs > 1 that are not prime.
We will discuss how to analyze a program to create a good test strategy in future lessons, as well as quantify how good our tests are.
Exercise
Our test_is_prime() has lumped together the program paths where the number is prime and the number is not. Reorganize this test into two test cases: one for each program path. Write one test case asserting only prime numbers ≥ 1, and the other only non-prime numbers ≥ 1.
Knowledge check
Question: In test code, a single function is called what?
Question: How many program paths will a function with a single if-else statement have?
Question: What is a program path?
Question: Conceptually, what is a test case?
Question: Besides generally being more organized, why do software developers want to split up their tests into multiple test cases?
Question: Suppose you have a program file that defines the functions foo() and bar(). How many test cases should you have at a minimum in your test code? What should they be named?
6.4 - Control Flow Graphs
A simple but powerful analysis technique for understanding execution paths through source code.
One approach to systematically exercise the behavior of the system is through basis path testing: identify all program paths in the code and make sure we have at least one test case that exercises every path.
How do we identify all program paths? That is exactly what the control flow graph helps us to do. These graphs can help us to understand what our code does, and also gives us a powerful analysis tool for designing test cases as well as many other applications in computer science.
Definition and uses
A control-flow graph (CFG) is a representation of all program paths that might be traversed through a program during its execution. A program path is a sequence of execution steps like we learned about in debugging.
Frances (Fran) Allen was an IBM Fellow who devised the concept of control flow graphs in the 1960s. In 2006, she became the first woman to receive the Turing Award for her contributions to computer science.
Control flow graphs represent different blocks of code. A basic block is a sequence of non-compound statements and expressions in a program’s code that are guaranteed to execute together, one after the other.
Here are some examples and non-examples of basic blocks:
# A single statement is a basic block.x=1# A sequence of multiple statements and function calls is a basic block.x=5y=x+2z=f(x,y)print(x+y+z)# A basic block can end with a return or raise statement.x=5y=x+2returnf(x,y)# But a sequence of statements with a return/raise in the middle is# NOT a basic block, since the statements after the return/raise aren't# going to execute.x=5returnxy=x+2# Will never execute!# An if statement is not a basic block, since it is a compound statement.# The statements it contains aren't guaranteed to execute one after the other.ifx>5:y=3else:y=4
Typically we treat basic blocks as being maximal, i.e., as large as possible. So if we have a sequence of assignment statements (x = 5, y = x + 2, etc.), we treat them as one big block rather than consisting of multiple single-statement blocks.
Now let’s look at that if statement example in more detail. We can divide it up into three basic blocks: one for the condition (x > 5), then one for the if branch (y = 3) and one for the else branch (y = 4). We can now formalize this idea, and extend it to other kinds of control flow statements like loop.
Formally, a control flow graph (CFG) of a program is a graph \(G = (V,E)\) where:
\(V\) is the set of all (maximal) basic blocks in the program code, plus one special element represent the \(end\) of a program.
\(E\) is the set of edges, where:
There is an edge from block \(b_1\) to block \(b_2\) if and only if the code in \(b_2\) can be executed immediately after the code in \(b_1\).
There is an edge from block \(b\) to the special \(end\) block if and only if the the program can stop immediately after executing the code in block \(b\). This occurs if there is no code written after \(b\), or if \(b\) ends in a return or raise statement.
Building a CFG
Here are the rules:
When you draw a node, you will write either the actual statements or the line numbers inside the rectangle.
Decision nodes: Draw as a diamond or a highlighted rectangle. These are blocks that either (a) transfer control by performing a function_call(), or (b) make a decision with if-else, try-exceptfor, or while. You do not create a decision nodes for built-in functions like print() or input(). A try-except block is a decision node on the try; the except blocks are regular nodes (usually).
Regular nodes: Draw as a rectangle. These are blocks code that executes in sequence without jumping. You group multiple lines of code together into one regular node when they execute in sequence.
End node: Draw two concentric circles with the inner one filled-in. This represents the “end” of the control flow that you are modeling. It does not represent a line of code.
Edges: Draw a line with an arrow at the end to represent the control flow passing from one node to another.
Regular nodes will have a single incoming edge and a single outgoing edge indicating program control flows in and out of the code block.
Decision nodes will have a single incoming edge. They will have either two outgoing edges in the case of if-else, for, and while statements or one outgoing edge if a function_call() that activates a new function. Label the outgoing edge(s) of the decision node with the function_call() or the condition, e.g., x < 0 or x >= 0.
For try nodes, you have a single incoming edge. You have one outgoing edge to the internal nodes of the try, and one outgoing edge to each except and finally block.
The end node can have many incoming edges, and will have no outgoing edges.
We can model a CFG for an entire program, a selected block, or individual functions. CFGs can get lengthy quickly, so you are best off working with separate, small functions.
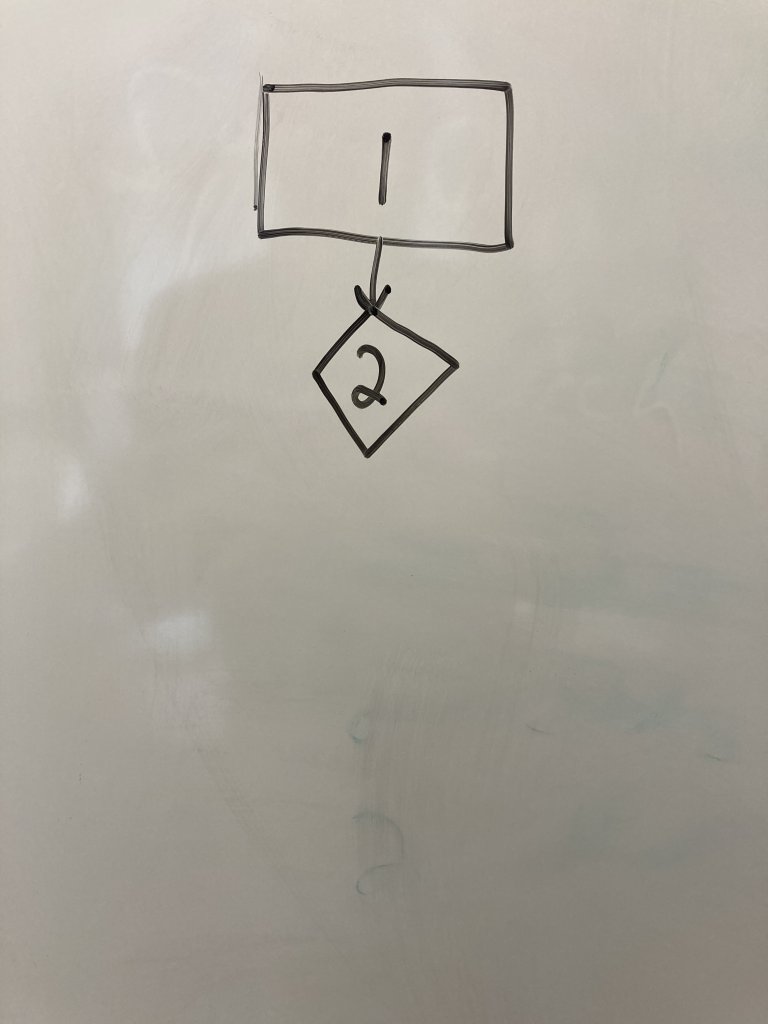
We will use line 1 def check_number(x): as our start point. It is a regular node because no decision is made. Draw a rectangle at the top of a sheet of paper. Write ether the line number or the entire line of code inside the node.
Below the first node, draw a diamond or highlighted rectangle box to represent a decision node for line 2. Decision nodes are used when you encounter if-else, for, or while loops or a call to a user-defined function(). Draw an edge connecting the first node to the second.
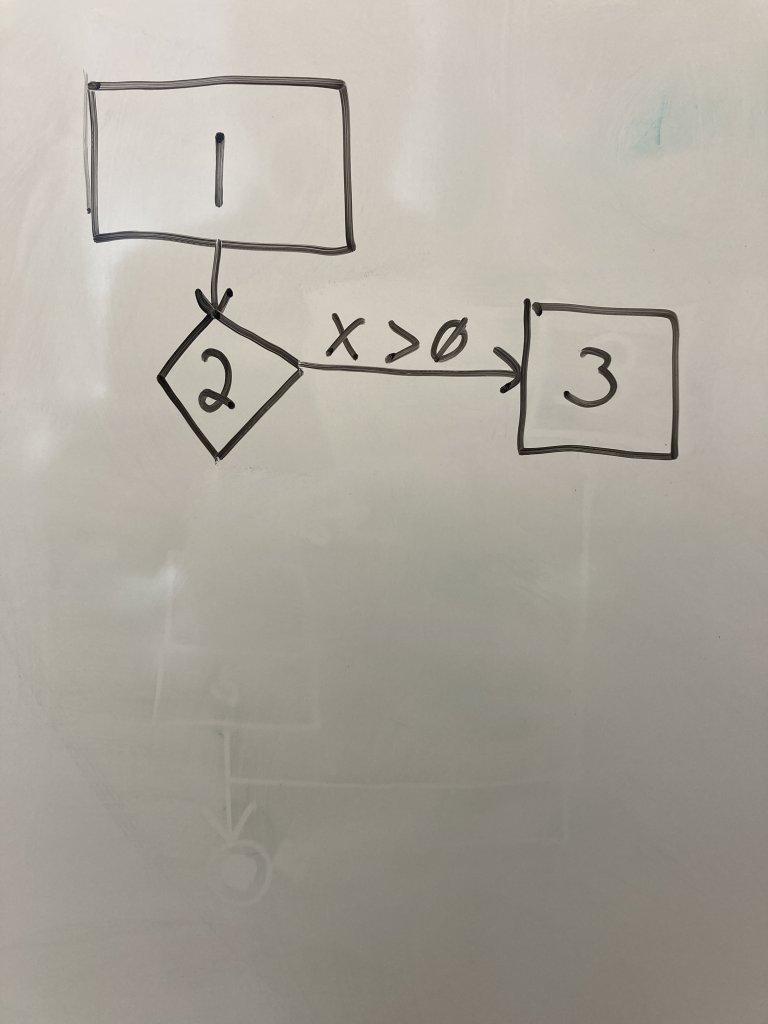
Draw a regular node for line 3 as a rectangle next to the line 2 node. Regular nodes represent blocks of code (in this case only one line) that executes in sequence with no decisions or calls to other functions. Draw an edge from line 2 to line 3 and label it with the condition that transfers control to line 3.
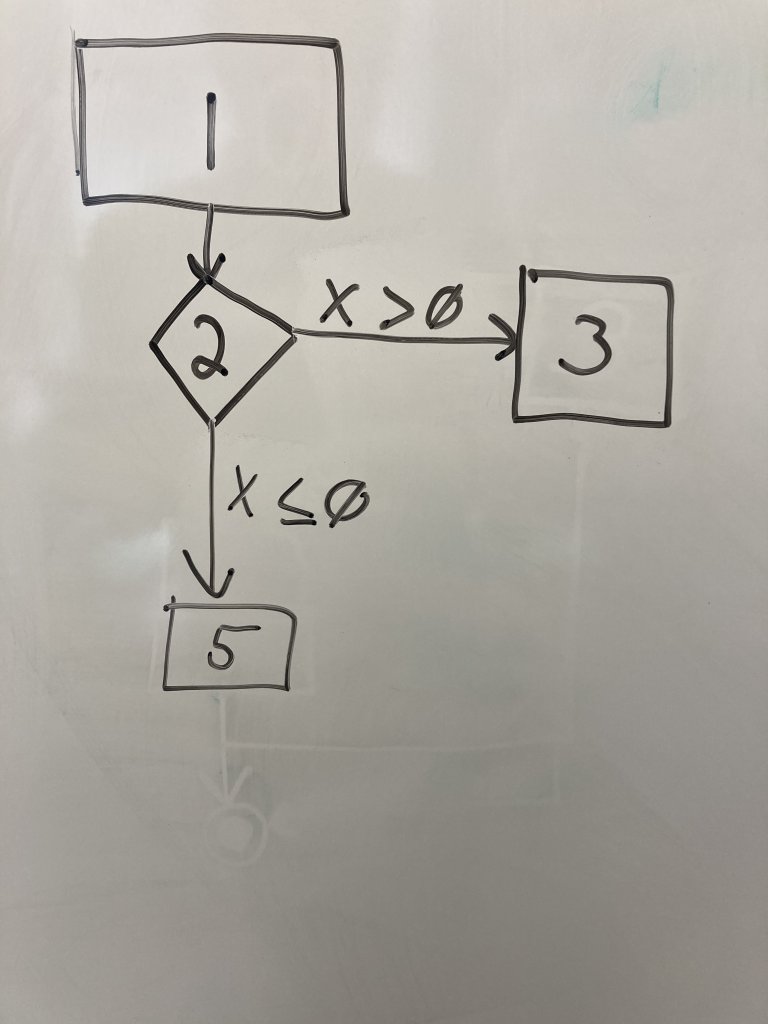
Draw another regular node representing line 5 below the line 2 node. Draw an edge from line 2 to 5 and label it with the condition that transfers control to line 5.Note that we DO NOT draw a node for the else on line 4. It is a part of the if decision node on line 2. However, if we have if-elif, we would draw another decision node. We are just capturing the if comparisons in our graph.
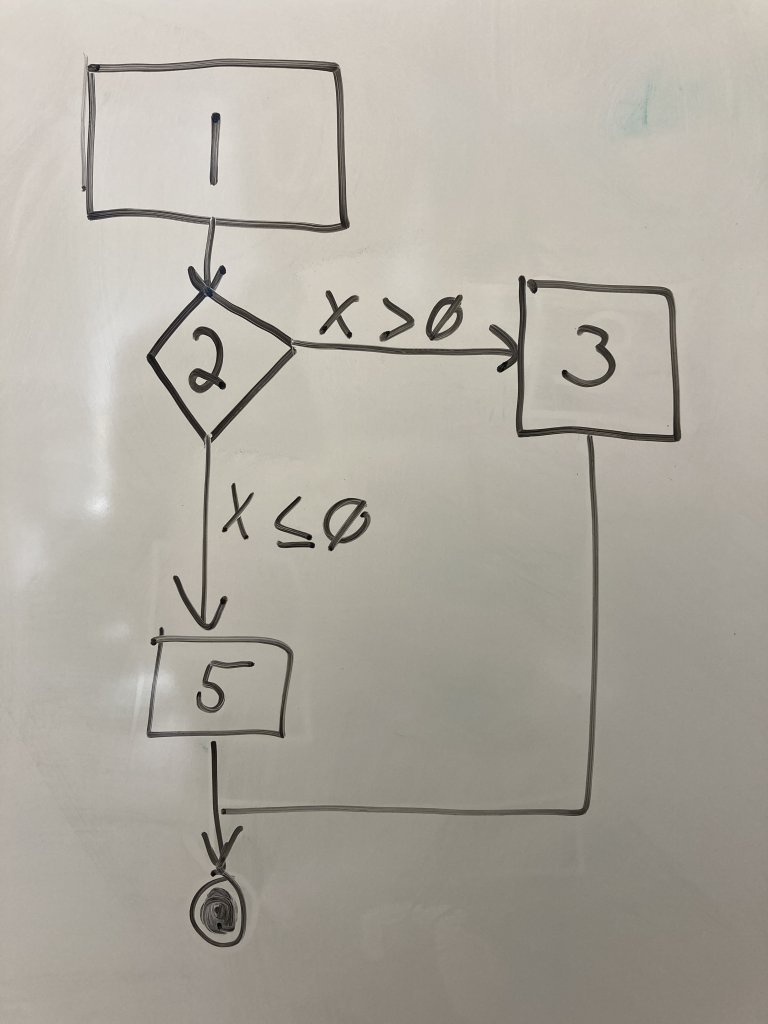
Finally, we need an end node to indicate the end of the program paths. Draw two concentric circles below the other nodes. Connect lines 3 and 5 to this end node. This node does not represent a line of code, but indicates the end of the execution we care about.
Now we have a CFG for a very simple block of code. Tracing the execution of the program becomes a matter of tracing your pen through the nodes and, when you reach decision nodes, determining how the variables values determine the flow of control.
Identifying unique program paths
One of the most important uses of a CFG is that it enables us to identify all the unique program paths in the code. Again, a program path is a sequence of execution steps like we learned about in debugging.
Question: Can how many unique program paths are indicated by the CFG? What are they?
To answer this question, you trace the set of nodes executed during a single “run” of the code block. A path is the set of nodes executed. Note that we have a decision node (line 2). So when the program executes, we have to choose a path, either going through 3 or 5 because the program makes a choice based on the value of x.
So the answer, then, is there are two unique program paths:
The path (1,2,3)
The path (1,2,5)
Now, in basis path testing we will write test code (assertions) with values that exercise all paths at a minimum. So for the above simple example:
Why do we care about the unique program paths? Because we can measure how good our unit tests are based on the number of unique program paths covered. So, our goal becomes to design our test cases so that the set of tests hits every unique program path. Sometimes this is easier said than done. Test coverage is a measure of how many program paths are covered by a test of test cases, and test coverage is used throughout the industry as a measure of test quality. We will use a tool to calculate the test coverage in a future lab.
Exercise: Multiple return paths
The following example has multiple ways to return out of the code block. You would treat raising an exception as returning.
Try to draw the CFG for this example. Some pointers:
Lines 2 and 4 are both decision nodes.
return statements are treated as regular nodes, but they all go to the end node.
Make sure to label your decision nodes’ outgoing edges with the condition.
Exercise: Loop example
Consider the following code that includes a loop.
1
2
3
4
 5
 6
 7
 8
 9
10
11
defprocess_numbers(nums):evens=0odds=0fornuminnums:ifnum%2==0:print(f"{num} is even")evens+=1else:print(f"{num} is odd")odds+=1returnevens,odds
Try to draw the CFG for this example. Some pointers:
A loop is a decision node. In the case of this for loop, if there are still num remaining in the list, you go to 3. Otherwise, the program block is ended because there is nothing left after the for loop.
Where do you go after lines 4 and 6? Back to the for loop.
Knowledge Check
Question: What is a program path, and how is a CFG related to program paths?
Question: What do you label the outgoing edges of a decision node with?
Question: How many unique program paths exist in the Loop example? What are they?
Question: Write one or more test cases that exercise all unique paths in the Loop example.
Question: Write a test case that exercises all the unique program paths the Multiple return paths example? What are they?
Question: We didn’t model an exception scenario. Apply your critical thinking and the rules at the top of this lab to create a CFG for the following function:
1
2
3
4
5
6
7
8
9
10
11
12
defanalyze_data(data):evens=0odds=0foritemindata:ifisinstance(item,int):ifitem%2==0:evens+=1else:odds+=1else:raiseValueError("Invalid data type")returnevens,odds
6.5 - pytest
Use a test framework, pytest, to run tests and collect results.
Test frameworks
We developed organized, thorough unit tests in in previous labs.. Our test code is looking good, but we still need to address two issues for it to be truly useful:
We would like to know if multiple test cases are failing.
We would like to collect our test results in a human-friendly format.
Automated test frameworks address these find and execute test code (often through naming conventions like test_*), capture assertion exceptions (test case failures), and generate summaries of which tests pass and fail.
Automated test frameworks are an integral part of modern software engineering.
Introducing pytest
We will use an automated test framework for Python called pytest. Test frameworks are language-specific. Java has JUnit, C++ has CPPUnit, JavaScript has multiple options, etc. Automated test frameworks exist for nearly every programming language and do largely the same things.
pytest is a library. Libraries are source code or compiled binaries that provide useful functions. They are almost always written in the same programming language as the program code. Professional software engineers use third-party libraries, often open source, to provide functions that they would otherwise have to write themselves.
In our case, we could write some try-except blocks to catch our assertion exceptions, create counters to track the number of tests passed or failed, and then print out the results. But why do that when we can use a library? No sense in reinventing the wheel.
Installing pytest with pip
We install pytest and another tool we will use later from the CLI. Choose your operating system below and follow the instructions:
pip3 install -U pytest pytest-cov
# Run in the PyCharm integrated Terminal pip install pytest pytest-cov
What is pip? It is basically the App Store for Python packages. A package contains one or more libraries or executable tools. pip was included when you installed Python on your computer. We will use pip again to install useful packages in future labs.
Running test code with pytest
Open your testing-lab/ directory as the top-level project in PyCharm. If you need them, grab sample.py and test_sample.py and put them in that directory.
Run pytest test_sample.py in the PyCharm integrated terminal. You should see console output similar to the following:
collected 3 items
test_sample.py ... [100%]================3 passed in 0.01s =================
pytest scans your test file looking for functions that follow the naming convention test_<function_name> and “collects” them. I had three test case functions in my code, but you may have more or less, so your “collected” number may be different. Test case function names must start with test_ for pytest to run them.
pytest then calls each test case separately and checks to see if the test case throws an AssertionError. If so, the test case fails. If not, the test case passes
Let’s introduce errors in our program code sample.py to show pytest collecting multiple test case failures, which is one of our improvements needed for automated unit testing.
Open sample.py and make the following changes:
1
2
3
4
5
6
7
8
9
10
11
12
13
defpalindrome_check(s):# cleaned_str = ''.join(s.lower()) cleaned_str=''.join(s)# this makes "Kayak" no longer a palindrome because of different case returncleaned_str==cleaned_str[::-1]defis_prime(n):# if n <= 1:ifn<=0:# the algorithm will now say that 1 is prime, which is incorrect by definitionreturnFalseforiinrange(2,int(n**0.5)+1):ifn%i==0:returnFalsereturnTrue
Now run pytest test_sample.py again. Your output should now look something like this:
collected 3 items

test_sample.py FF.                                                                                                                               [100%]

======================================================================= FAILURES =======================================================================
___________________________________________________________________ test_palindrome ____________________________________________________________________

    def test_palindrome():
        assert sample.palindrome_check("kayak")  # the function should return True, giving "assert True"
>       assert sample.palindrome_check("Kayak")
E       AssertionError: assert False
E        +  where False = <function palindrome_check at 0x1023494e0>('Kayak')
E        +    where <function palindrome_check at 0x1023494e0> = sample.palindrome_check

test_sample.py:5: AssertionError
____________________________________________________________________ test_is_prime _____________________________________________________________________

    def test_is_prime():
>       assert sample.is_prime(1) is False
E       assert True is False
E        +  where True = <function is_prime at 0x1023493a0>(1)
E        +    where <function is_prime at 0x1023493a0> = sample.is_prime

test_sample.py:9: AssertionError
=============================================================== short test summary info ================================================================
FAILED test_sample.py::test_palindrome - AssertionError: assert False
FAILED test_sample.py::test_is_prime - assert True is False
============================================================= 2 failed, 1 passed in 0.03s ==============================================================
We can see at the nice human-friendly summary at the end that 2 failed and 1 passed. The names of the test cases that failed are printed, as are the exact assert calls that failed.
Other ways of running pytest
You can run pytest without giving it a target file. pytest will scan the working directory looking for files with the naming convention test_<file>.py. It will collect and run test cases from all test_<file>.py it finds.
Try running pytest --tb=line to get a condensed version of the results if you find the output to be overwhelming.
Recap
We accomplished a couple significant things in this lab:
We installed the pytest package using pip. Again, you only need to do this once.
We ran pytest, which scans for files and functions named test_* and runs them.
pytest collects test case successes and failures independently from one another, allowing us to get more information with each run of our test code.
pytest displays a summary of the results in human-friendly format.
All popular programming languages have a test framework. You will need to seek out one for the language you are working in.
Knowledge check
Question: The Python tool we run to install Python packages is called _______.
Question: For pytest to find and execute tests automatically, the test files and test cases must begin with __________.
Question: (True/False) You can have multiple assert statements in a single test case?
Question: Create a file called math.py with the following function:
defcompute_factorial(n):ifn<0:return"Factorial is not defined for negative numbers."elifn==0orn==1:return1else:factorial=1foriinrange(2,n+1):factorial*=ireturnfactorial
Create a new, appropriately-named test file for math.py.
Implement one or more test cases that cover all program paths in the function.
Use pytest to execute your test code.
6.6 - Testing for exceptions
How to test for expected exceptions.
Before you start
If necessary, fix up your sample.py so that all your test cases pass.
Testing for exceptions
Sometimes, the expected behavior of a function is that it throws an exception. How do we test for expected exceptions given an input?
Suppose we want reverse_string() to work only for strings containing the letters [a–z] and to throw an exception if the string contains any other characters. Change reverse_string() in sample.py to the following:
This is appropriate given the requirements of reverse_string(). It returns a reversed str input under normal circumstances, but raises an exception under abnormal circumstances, a.k.a., exceptional conditions from our problem statement structure.
“Raising” and “throwing” an exception are the same thing. You will hear both terms in practice. The keyword in Python is raise, and exceptions in Python always end with the string Error, e.g., ValueError or IndexError.
Exercise
Define a new test case in test_sample.py named test_reverse_exception and add a call to sample.reverse_string with an input that will trigger the exception.
Run pytest. You should see a test summary similar to the following:
================================= short test summary info=================================FAILED test_sample.py::test_reverse - ValueError: letters a-z only
FAILED test_sample.py::test_reverse_exception - ValueError: letters a-z only===============================2 failed, 2 passed in 0.06s ===============================
I have two test failures: the new test case I created, and the original test_reverse. This is because test_reverse in my code contains the call assert sample.reverse_string(''). The empty string does not consist of the letters [a–z], so an exception is correctly raised.
This is an important lesson: as program code evolves, so too might the test code. Move the assert sample.reverse_string('') to the test_reverse_exception test case where it logically belongs.
Your test cases for reverse_string should now look something like this:
13
14
15
16
17
18
19
deftest_reverse():assertsample.reverse_string("press")=="sserp"# checking result for equality with expectedassertsample.reverse_string("alice")=="ecila"deftest_reverse_exception():sample.reverse_string("abc123")sample.reverse_string("")
Verifying expected exceptions with pytest
Our assert statements only check the return values of functions. pytest provides a convenient helper function to check if an exception was raised.
First, add the line import pytest to the top of your test code file test_sample.py.
Second, change test_reverse_exception to the following:
18
19
20
21
22
23
24
deftest_reverse_exception():withpytest.raises(ValueError):# the pytest.raises comes from the imported pytest modulesample.reverse_string("abc123")withpytest.raises(ValueError)aserr:# we can optionally capture the exception in a variablesample.reverse_string("")assertstr(err.value)=="letters a-z only"# convert the exception to a str and verify the error message
A few things of note:
pytest.raises(...)requires that you specify the type of exception. In our case, we expect a ValueError to be raised.
We can optionally capture the exception itself. That’s what as err does on line 22. err is a variable (name it whatever you want) that captures the exception.
On line 24, we can call str(err) to convert the exception to a string. That error message should be "letters a-z only", which comes from the line raise ValueError('letters a-z only') in sample.py.
This test case would fail if reverse_string()did not raise an exception
Exercise
Comment out the if-statement and exception raising lines in reverse_string() and rerun pytest. How does the pytest output for an expected exception differ from a failed assert?
Checking exception values
Checking the exception message is useful because we may want our function to raise ValueErrors under different circumstances. For example, maybe we want to raise a ValueError for the empty string that says ‘string cannot be empty’, and a different ValueError for letters a-z only.
Why would you want to raise two different ValueErrors? Because it tells the caller of reverse_string() what they did wrong and how to fix it. It’s similar rationale to why we split our assert statements and our test cases into multiple instances to get more precise info.
Exercise
Put the if-statement and exception raising back in reverse_string(). Add an if-statement at the beginning of the function to check if the input parameter is the empty string. If so, raise ValueError('string must not be empty'). Re-run pytest. What happens?
Modify your test_reverse_string so that both with pytest.raises(...) calls capture the error as in line 22. Add/modify assert statements to verify that the appropriate error message is in the exception.
Recap
We accomplished a couple significant things in this lab:
We installed the pytest package using pip. Again, you only need to do this once.
We ran pytest, which scans for files and functions named test_* and runs them.
pytest collects test case successes and failures independently from one another, allowing us to get more information with each run of our test code.
pytest displays a summary of the results in human-friendly format.
Knowledge check
Question: (True/False) Raising and throwing exceptions are two different things.
Question: Why should you not exception logic in the same test case where you test “normal” logic?
Write a code block using pytest that checks that the determine_priority(str) function correctly throws a TypeError when passed anything other than a string.
Question: What happens when running pytest and the program code raises an exception that you do not expect?
Software engineers need some measure of the quality of the tests they write. This is not a simple question to answer.
Does a good test find bugs? Hopefully, but also, we should be writing our code to not have bugs!
Do we count how many lines of test code we have? Is it more than source code? Maybe, but that doesn’t mean we are testing the right things.
Do our tests check independent things in the code? How can we determine that automatically if so?
Measuring test case quality is not straightforward, but there is one generally agreed-upon measure used as a baseline: test coverage.
Test coverage
Test coverage is a measure of how much of source code is executed when the tests run. There are three measures of “how much”:
Line coverage or statement coverage is the percentage of source lines of code executed by your test cases. We do not include test code lines when counting the percentage of code.
Branch coverage is the percentage of program paths executed by your test cases.
Conditional coverage is the percentage of Boolean conditions executed by your test cases.
Consider the following (very poorly designed and implemented) code snippet:
This test case has 100% line coverage because all lines of code are executed.
This test case has 50% branch coverage because only one program path is executed: the path where the if-statement evaluates to True.
This test case has 33% conditional coverage because only one boolean conditional is checked (is_authenticated is True), but the other expressions user_id.startswith('admin') and caller == privileged are not.
Line coverage is the least precise, and conditional coverage is the most precise.
Test coverage is computed over the union of all source lines, branches, and conditions executed by our test cases. So we can easily write additional test cases that, collectively, reach 100% statement, branch, and condition coverage.
You want to target 100% condition coverage, but achieving 100% of any coverage can be challenging in a real system. Exception handling and user interface code in complex systems can be hard to test for a variety of reasons.
In practice, most organizations aim for 100% line coverage as a target.
Using pytest-cov to compute test coverage
Most test frameworks, like pytest and Junit (for Java), also have tools for computing test coverage. Manually computing these measures would be too tedious. These tools compute line coverage, but not always branch coverage, and almost never condition coverage because of the technical challenges of automating that calculation.
We installed the pytest-cov tool when we installed pytest. Refer to the instructions for installing pytest and pytest-cov
Open a Terminal in the directory where you were working on your unit testing examples. Run the following:
Running pytest-cov
Run the following command from your Terminal in the directory with sample.py and test_sample.py from the previous labs.
pytest --cov . - This tells pytest to run tests in the current directory, ., and generate the coverage report. You should see something similar to the following:
=============================================================test session starts==============================================================platform darwin -- Python 3.12.2, pytest-8.3.3, pluggy-1.5.0
rootdir: /Users/laymanl/git/uncw-seng201/content/en/labs/testing/coverage
plugins: cov-5.0.0
collected 4 items
test_sample.py .... [100%]---------- coverage: platform darwin, python 3.12.2-final-0 ----------
Name Stmts Miss Cover
------------------------------------
sample.py 236 74%
test_sample.py 233 87%
------------------------------------
TOTAL 469 80%
==============================================================4 passed in 0.03s ===============================================================
pytest executes your tests as well, so you will see test failures outputted to the screen. Note that failing tests can lower your test coverage!
The general format for the command is pytest --cov <target_directory>
To get branch coverage, run the command pytest --cov --cov-branch <target-directory>
Generating a coverage report
You can also generate an HTML report with pytest --cov --cov-branch --cov-report=html <target-directory>. This will create a folder named htmlcov/ in the working directory. Open the htmlcov/index.html file in a web browser, and you will see an interactive report that shows you which lines are and are not covered.
Knowledge check
Test coverage is a measure of how much _________________ is executed when the __________________ runs.
Explain the difference between branch coverage and conditional coverage.
Give an example of a function and a test case where you have 100% branch coverage but <100% conditional coverage.
(True/False) Branch coverage is more precise than statement coverage.
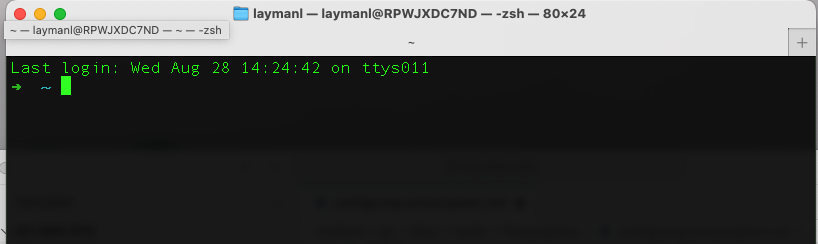
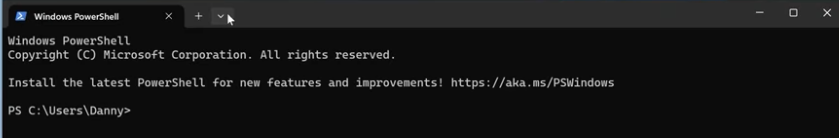
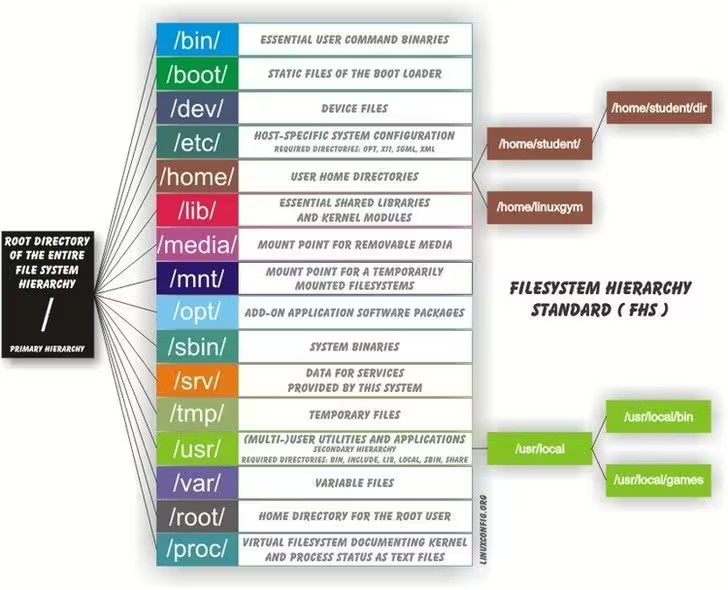
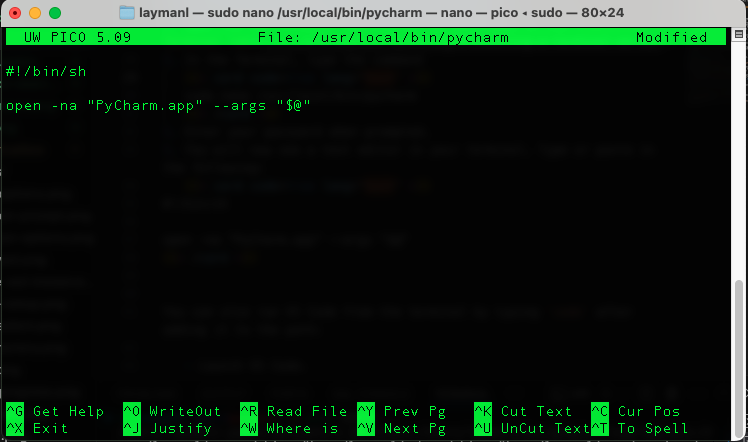
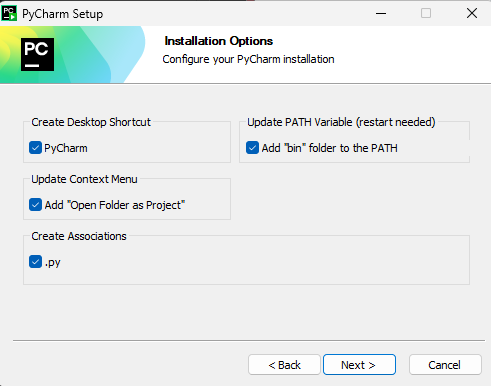
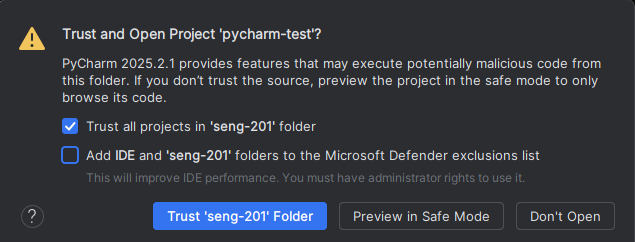
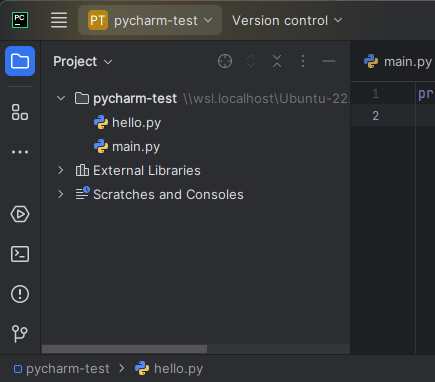
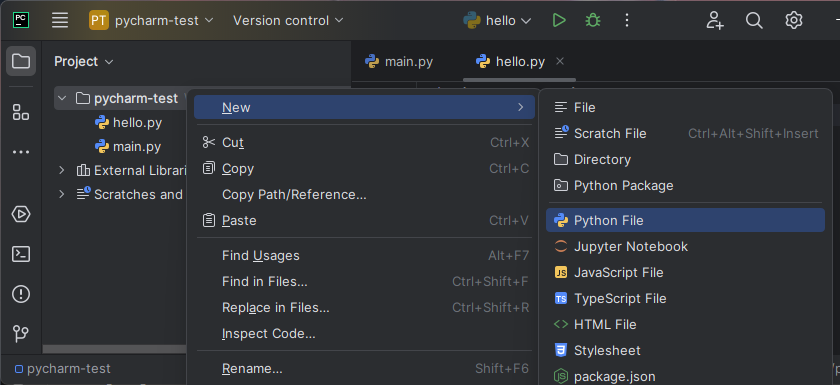
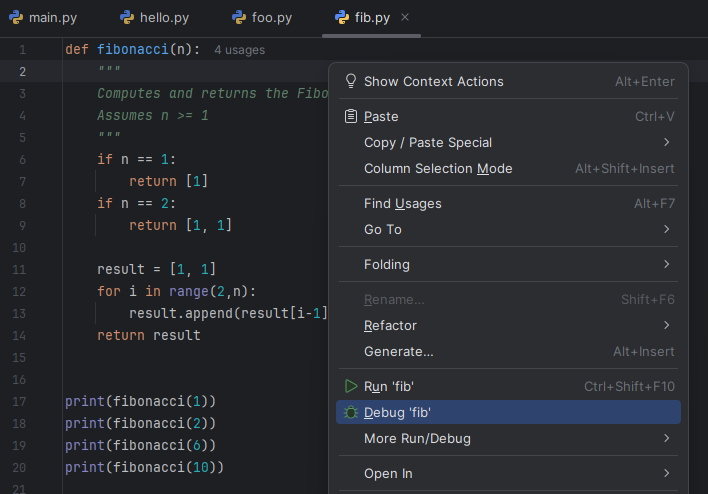
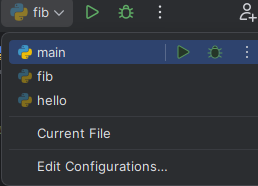
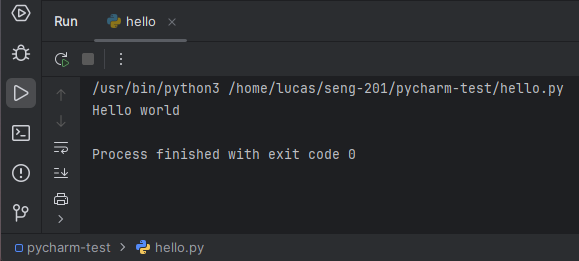
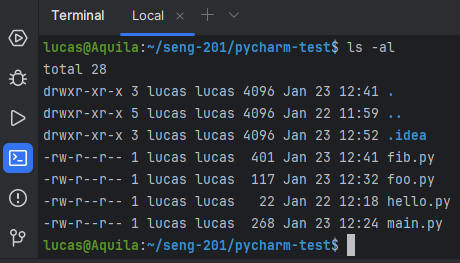
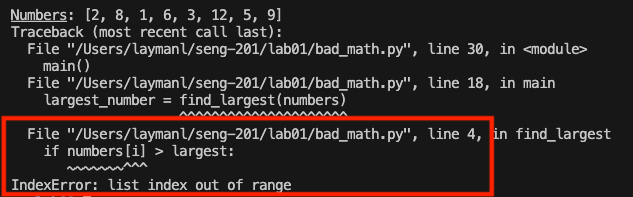
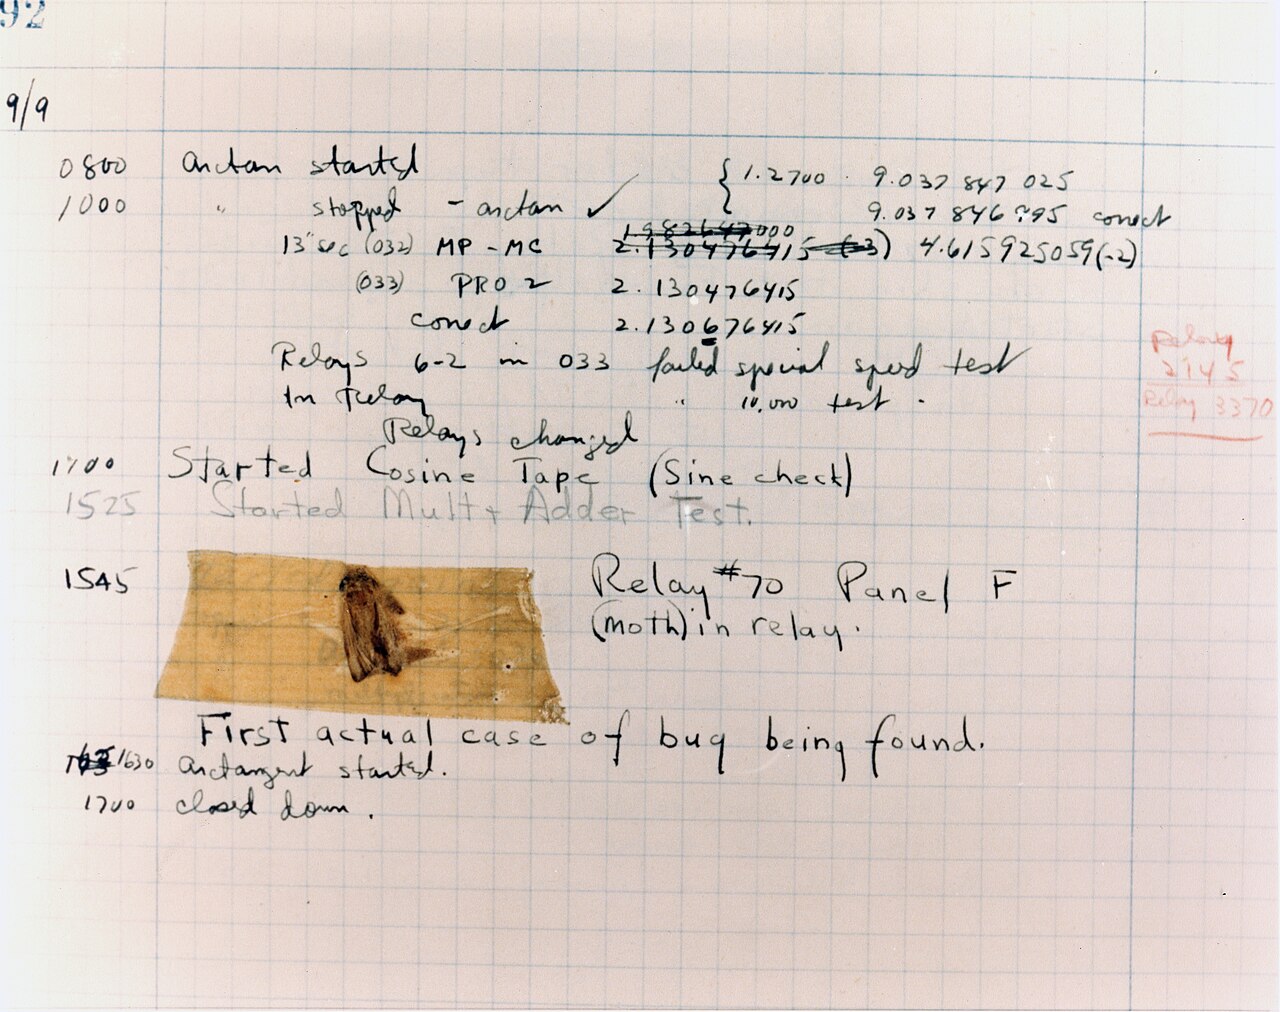
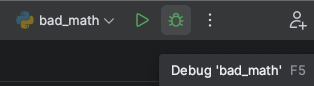
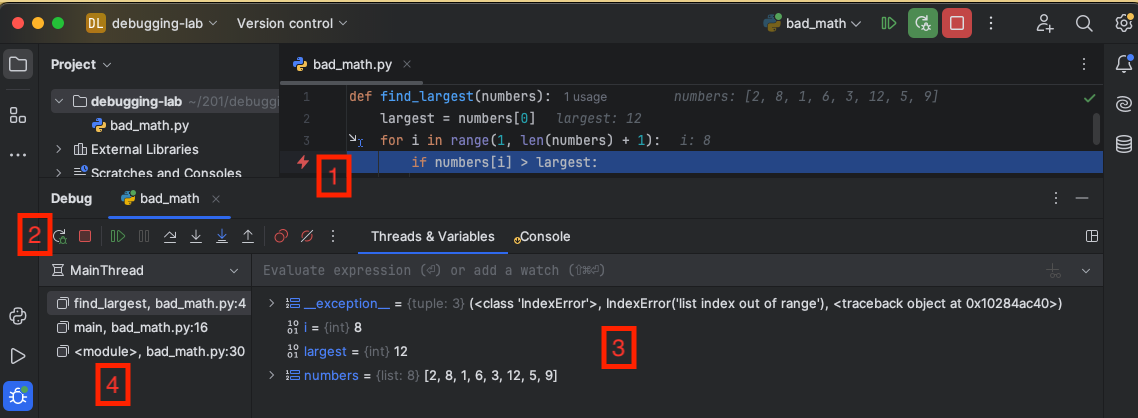
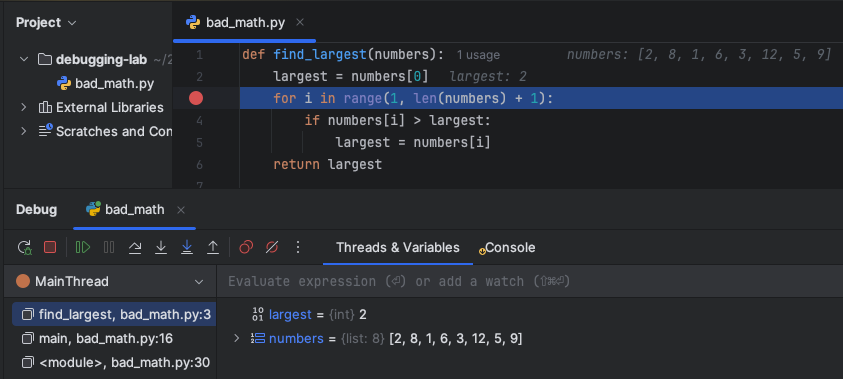
 - Resume execution until the next breakpoint or the program ends.
 - Step Over the current line, which means evaluate the line and go to the next one.
 - Step Into the current line. If the current line calls a function like
  - Step Into My Code. The same as the previous Step Into, but only step into source code files in your project. Suppose you call
  - Step Out of the current function. This will immediately complete all lines of the current function and pause at the line that called the current function in the call stack.
 - Restart the debugging on the program. Just like re-running it. All your breakpoints will be retained.
 - Stop the debugger without further execution of the code.
