This class recording here is the companion to the Terms and Concepts and PyCharm Debugger labs below.
1 - Terms and concepts
Vocabulary you need to know plus what debugging really is.
Setup
Open your Terminal:
Terminal app on Mac
PowerShell on Windows
Use the Terminal to create a directory called debugging-lab/ in the same place you are gathering all your code for this class.
Download bad_math.py and save it to the debugging-lab/ directory.
Open the debugging-lab/ directory with PyCharm.
Select the bad_math.py file, then Run it WITHOUT DEBUGGING, either:
Right click in the editor and select Run 'bad_math'
Click the Play button next to bad_math in the toolbar
The program should crash with an error.
What is debugging?
Debugging is the process of understanding how a program arrived at a particular state.
Errors are incorrect calculations or bad states of a program. An error occurs while the program is running. Errors show as bad output, crashes, and the like. Debugging is often about comprehending how you arrived at an error.
Defects are programming mistakes, logic flaws, or problems with design that could lead to errors. What did you do wrong?
Defects are problems or mistakes, errors are the tangible result of running a program with a defect.
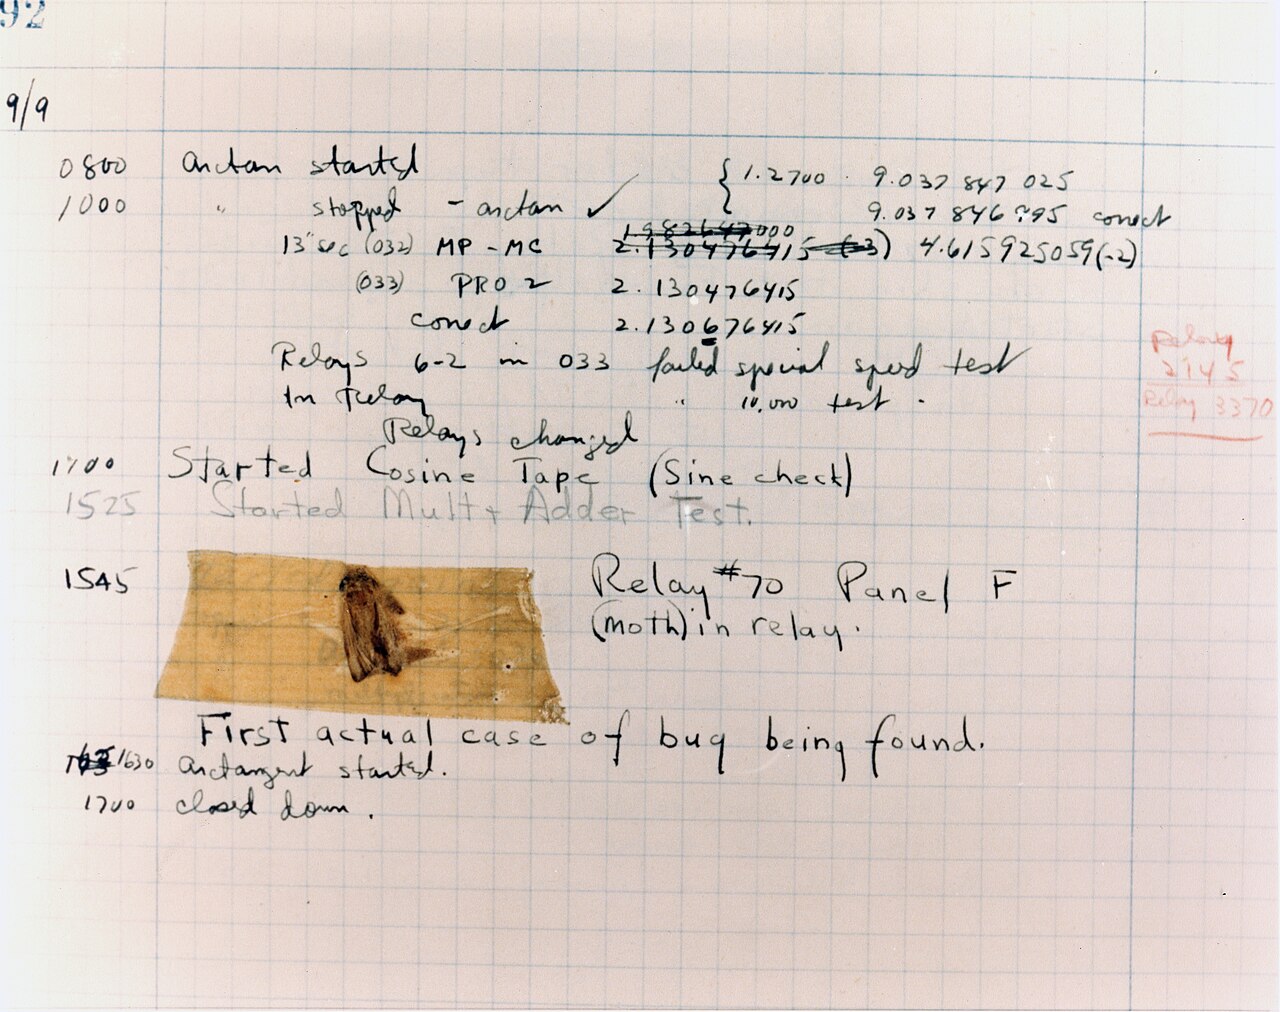
Colloquially, we conflate these two terms into the concept of a “bugs”, and hence the term “debugging”.“Bug” is an old term pre-dating computers, but Admiral Grace Hopper, who is the main reason we no longer program in Assembly Language, popularized the term “bug” in computing after she found one in the Harvard Mark II computer:
What is program state?
You have no doubt used print() statements to understand your program by printing variables, or printing here to see if a line executes is common. You are debugging using print statements.
Think about what these print statements tell you. They tell you:
What are the variable values at a point in time?
Which lines of code are getting executed when?
These two pieces of information are the essence of debugging. Let’s formalize them:
step: the program statement (often a single line of code) that was just executed.
state of a program is comprised of:
the variable values at the step.
the call stack at the step. We will explain this in a moment.
Debugging is trying to understand how you arrived at a state. Sometimes that state is an error, sometimes you want to figure out how you get to a certain point.
Debugging from an exception
Let’s examine some debugging info assuming you follow the Setup at the top of the lab.
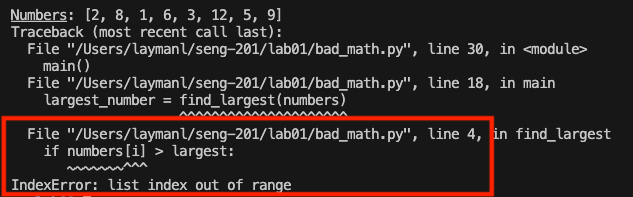
If the program crashes due to an exception, the stack trace will usually point you to the line of code that exploded:
There is a lot of useful information in this stack trace to start the debugging process.
It tells you that the error is in bad_math.py, line 4 and even shows you the offending line of code.
Don’t fix any bugs yet. We want them for the next lab.
The error is an IndexError: list index out of range. So the program tried to execute numbers[i] but likely i was too big.
The other lines show the call stack, or the chain of function calls that are active in memory. In Python, the top-most function was called first, and the bottom-most function was called last (it is the reverse in Java):
Line 30 of <module> called the main() function.
- <module> represents the file bad_math.py itself and any code in the file that is not in a function or class.
Inside main() on line 18, largest_number = find_largest(numbers) was called.
Finally, inside find_largest(), the buggy line was called that generated the exception and crashed the program.
So the call stack is the chain of active functions that are waiting for something to be computed and returned. <module> -> main() -> find_largest(), which errored out. Look at the code itself to confirm the chain of function calls.
Congratulations! You have found some essential debugging information: the step at which the error occurred and the call stack portion of the state. What key debugging information are you missing?
The variable values! Now go to line 4. Add print(i) and print(numbers) right before that line to see what values i and numbers when the crash happens. That should give you a strong hint on what happened and how to fix it.
Don’t fix any bugs yet. We want them for the next lab.
Debugging is a process
A good software engineer follows a structured process. Use the exception message or your knowledge of the program to say, “Well, the problem could be this.” Form a hypothesis. Then add print statements to help determine state around the problematic step. Try different input values to confirm your hypothesis.
Maybe you will discover your hypothesis is incorrect. No problem! Maybe the error is actually due to something earlier in the call stack. Move your print statements up the stack and try again.
Whatever you do, build and refine your hypotheses. Do not just try something to see if it works. You may get lucky and fix the problem, but if you don’t understand the fix, how do you really know? You will also be doomed to make the same mistake again if you don’t understand what happened.
A better way?
You can debug just fine with print statements, but managing them is tedious. You will also have times where it would be useful to pause execution of the program at a certain point say, on the first iteration of a loop.
You can get state with print and control steps with code, but modern debugging tools will simplify this process while keeping your code clean.
We illustrate how to use PyCharm’s debugger in the next lab.
Knowledge check
Question: What two elements comprise the state of a program at a particular step?
Question: Suppose you use a constant value that never changes in your program, like pi = 3.14159. Do you think the variable pi is part of the program state? Why or why not?
Question: When do you see a stack trace? What information does it contain?
Question: Explain the difference between an error and a defect. Give an example of a defect and its resulting error.
Question: What information about the running program is contained in the call stack?
2 - The PyCharm debugger
Use the power of the IDE to understand your code.
Debugging support tools have been around since the 70s. All modern IDEs let you control the steps of program execution while showing the program state. Debugging tools, properly used, are much more efficient than print statements.
Open the debugging-lab/ directory and open bad_math.py in an editor.
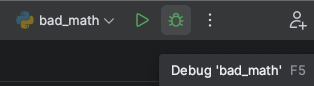
Run the program in debug mode by doing one of:
Hit your F5 key.
Right click in the code editor and select Debug 'bad_math'.
Click the Bug button at the top of PyCharm.
The PyCharm debugger should now launch. Notice that you are now in the Debugging pane of PyCharm, which is accessible anytime from the left sidebar. This pane will open any time you Run a program with debugging.
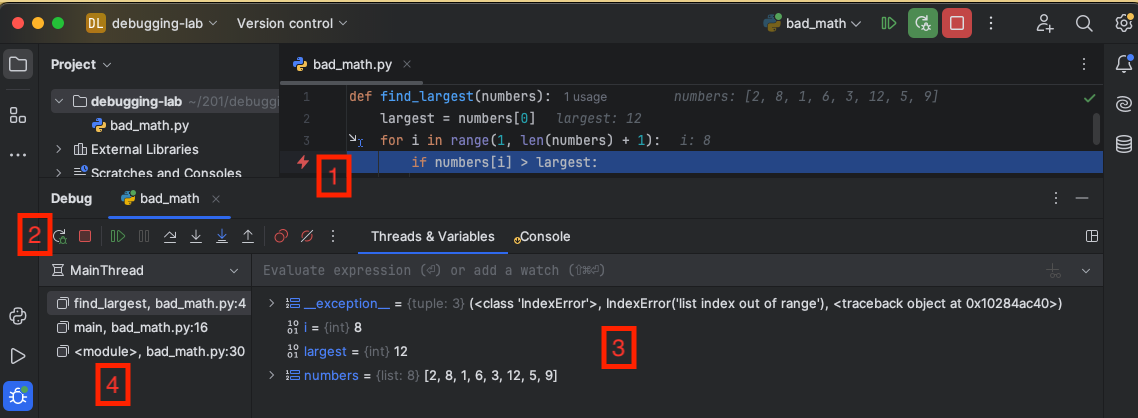
You should see something similar to the following:
The bad_math.py program should crash with an exception. Here are the essential elements you see:
The editor highlights the line where the program crashed. The red lightning bolt in the left indicates an exception was thrown. You can see the full exception text by clicking the “Console” tab.
These are the step controls. PyCharm automatically paused on the step that caused the crash. More on the controls below.
The variable pane shows the values of all variables in scope at the current step. Variable values are one part of the program state.
The call stack is the other part of the program state. It shows the stack of function calls that arrived at the current step.
Using the step controls, hit either the green “play” icon or the red “stop” icon. Stop will cancel execution and produce nothing, play will continue execution of the program, resulting in the exception printing in the Terminal (where the program is running) and the program will crash.
Breakpoints and stepping
The PyCharm debugger will automatically break (pause) execution on steps that throw an exception. You can look at the variable pane and call stack to understand the state of the program and hopefully gain insight into what happened.
However, you will often want to break execution at step of your choosing, not just when an exception happens. Maybe want to see how a value was computed and what the variables were well before the crash happened. Or maybe your program doesn’t crash at all, but simply produces the wrong output.
You add breakpoints in the IDE to tell the debugger on which step(s) to pause execution. To set a breakpoint:
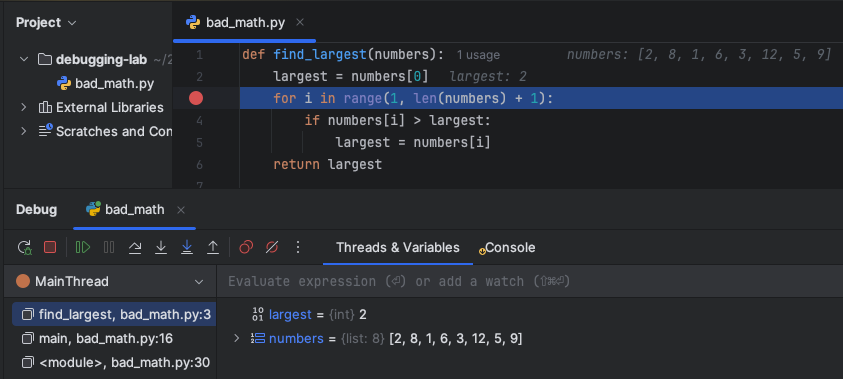
Set a breakpoint by left-clicking on the line number in the code editor. A red dot will appear to indicate the breakpoint. Set a breakpoint on line 3.
Click the breakpoint again to remove it.
You can set multiple break points.
You cannot set a breakpoint on a blank line of code.
Launch the debugger by pressing F5 or right-clicking and Debug 'bad_math'.
The debugger will break (pause execution) on line 3 or on whichever line you placed the breakpoint.Notice how PyCharm puts the current values of the variables largest and numbers in both the editor and the variable pane.
Use the step controls to control the execution of the program. All of these controls have a keyboard shortcut as well.
- Resume execution until the next breakpoint or the program ends.
- Step Over the current line, which means evaluate the line and go to the next one.
- Step Into the current line. If the current line calls a function like if my_fun(x) == True, the debugger will step into the my_fun() function and step through it. If you did step over, the debugger would evaluate the entire line including the my_fun() call without pausing.
- Step Into My Code. The same as the previous Step Into, but only step into source code files in your project. Suppose you call random.randint(0,10) which is a function imported from a Python library. Step Into will take you to the implementation of randint(). Step Into My Code will skip it because you did not write that code.
- Step Out of the current function. This will immediately complete all lines of the current function and pause at the line that called the current function in the call stack.
- Restart the debugging on the program. Just like re-running it. All your breakpoints will be retained.
- Stop the debugger without further execution of the code.
Use the controls to Step Over a few lines. Notice that the variable pane, watch pane, and call stack update with each step.
Using breakpoints and the step controls, you can precisely control the execution of the program to more methodically track down what is going on.
Adding a watch variable
The Threads & Variables pane shows all variables in scope at each step. In bigger programs, the variable list can be huge and you won’t care about most of them. To help, you can specify watch variables and watch expressions that always display at the top of the Threads & Variables pane.
To set a watch variable:
Set a breakpoint and start debugging the program
Select the variable in the editor or in the threads & variables
Right Click and Add to Watches
Now you will see your watched variables update as you step through the program. You can add as many watch variables as you like.
Adding a watch expression
You can also watch a complete expression, such as a boolean comparison. This can be particularly useful for debugging if-else statements and loops.
To set a watch expression:
Select the expression you want to evaluate in the editor.
The expression must be valid. So if you have the line if numbers[i] > largest:, select only the numbers[i] > largest portion of the statement.
Right click and Add to Watches.
Conditional breakpoints
You will also find it useful to only have a breakpoint trigger under certain conditions.
For example, you are reading file of 10,000 hospital patient records and you figure out that the program crashes when it gets to the record belonging to “Alice St. John”. Unfortunately, Alice is record 342. You don’t want to set a breakpoint on the offending line and have to hit the Continue control 341 times to figure out what’s going on with Alice’s data.
Enter the conditional breakpoint, which is a breakpoint that only pauses execution when an expression you specify evaluates to True. Try it with our bad_math.py sample:
Set a regular breakpoint on line 3 and Debug the program. It stops on the first iteration.
Right click on the breakpoint on line3. A textbox will appear. Type largest == 12 in the textbox.
Note: You can also add conditional breakpoints without creating a plain breakpoint first by right-clicking in the gutter.
Now hit the Continue control or restart the program in Debug mode. The conditional breakpoint will only pause when largest == 12.
Conditional breakpoints are extremely useful for refining your hypothesis as to what’s going on. Note you can enter any Python expression that evaluates to True or False, for example:
largest == 12 and i < 8
largest >= 5
Starting with vs. without debugging
When running your program, you have the option to Debug or Run. What’s the difference?
Run will not pause on breakpoints or exception, nor will variable values be tracked. Your breakpoints and watch variables will remain in PyCharm, but they are not updated.
Debug will do everything we showed, but significantly slows down the execution time of your program. This is because to enable debugging your code must be instrumented to enable the debugger to control execution and evalute variable or expression values. Think of instrumentation as adding an if breakpoint is True before every line of code as well as a print statement. Running debug mode for a large, complex system, can be costly.
Exercise
There are 4 bugs present in the initial bad_math.py that can be triggered based on which value the numbers variable has. The various calls to main() at the bottom of the file are sufficient to reveal all the bugs.
Find and remove them. There are multiple ways to squash the bugs. You may squash two bugs at once depending on how you fix the first bug that causes the exception we have seen in our examples.
Your output should look like the following if you gracefully fix the bugs:
Numbers: [2, 8, 1, 6, 3, 12, 5, 9]The largest number is: 12The average is: 5.75
✅ All calculations are correct.
--------
Numbers: [32, 16, 8, 4, 2, 1, 0]The largest number is: 32The average is: 9.0
✅ All calculations are correct.
--------
Numbers: []The list of numbers cannot be empty.
--------
Numbers: [2]The largest number is: 2The average is: 2.0
✅ All calculations are correct.
--------
Numbers: [12, 12]The largest number is: 12The average is: 12.0
✅ All calculations are correct.
--------
Knowledge check
Question: How do you run a program in debug mode in Pycharm?
Question: How do you add a variable to the watch list from the editor view?
Question: How do you set a conditional breakpoint that pauses when x evaluates to False?
Question: What is the difference between Step Over and Step Into in terms of the next step of execution?
This program tells you what the nth Fibonacci number is.
Enter a number for n: 4Fibonacci number 4 is: 3This program tells you what the nth Fibonacci number is.
Enter a number for n: 7Fibonacci number 7 is: 13
Inventory Management System
1. Add item
2. Remove item
3. Check stock
4. Exit
Choose an option: 1Enter item name: apple
Enter quantity: 10Added 10 of apple. Total: 10Inventory Management System
1. Add item
2. Remove item
3. Check stock
4. Exit
Choose an option: 2Enter item name: apple
Enter quantity to remove: 15Error: Not enough stock of apple to remove. <--- note change!
Inventory Management System
1. Add item
2. Remove item
3. Check stock
4. Exit
Choose an option: 1Enter item name: orange
Enter quantity: 10Added 10 of orange. Total: 10Inventory Management System
1. Add item
2. Remove item
3. Check stock
4. Exit
Choose an option: 2Enter item name: orange
Enter quantity to remove: 10Removed 10 of orange. Remaining: 0orange is out of stock. <--- note change!
 - Resume execution until the next breakpoint or the program ends.
 - Step Over the current line, which means evaluate the line and go to the next one.
 - Step Into the current line. If the current line calls a function like
  - Step Into My Code. The same as the previous Step Into, but only step into source code files in your project. Suppose you call
  - Step Out of the current function. This will immediately complete all lines of the current function and pause at the line that called the current function in the call stack.
 - Restart the debugging on the program. Just like re-running it. All your breakpoints will be retained.
 - Stop the debugger without further execution of the code.